There are different methods and techniques traders use to analyze financial assets. Some traders use fundamental analysis by researching the intrinsic value of an instrument, while others prefer to analyze the past performance of an instrument by utilizing technical analysis.
- Classical chart patterns are easily recognizable formations in price charts that traders use to predict future price movements.
- These patterns, rooted in technical analysis, are based on historical price action and are among the most well-known tools for traders.
- By leveraging these patterns, traders can find potential trading opportunities and make informed decisions.
On this page, you’ll find the complete list of classical chart patterns and a detailed explanation of each classical technical analysis pattern.
What are Classical Candlestick Patterns?
Classical or traditional chart patterns refer to a group of widely common price formations formed on price charts. These patterns are an integral part of technical analysis methodology and are widely used by analysts and technical traders to predict future price movements and establish a trading strategy.
In a simple explanation, technical chart analysis is based on the idea that prices tend to move in waves or trends and that past price performance can strongly indicate the future price movement of an asset.
Often, these classical patterns are based on support and resistance levels and trend lines, which indicate where the market might reverse or continue its ongoing trend. When the pattern appears, trades are looking for a level where the price breaks above or below a certain price level, and by using this data, they estimate the future direction of the market.
That being said, classical chart patterns are categorized into two main categories: trend reversal patterns and continuation patterns.
A reversal pattern indicates that the price action is about to change, while a continuation pattern signals that the prevailing trend is likely to continue. Moreover, for the vast majority of classical patterns, there’s both a bullish and bearish version.
Keep in mind that knowing how to identify and use these geometric patterns can be an effective way to analyze financial markets and find profitable trades. In that sense, a classical chart pattern has two main advantages when compared with harmonic or single candlestick chart patterns – they are easy to recognize and they are often viewed by many other traders.
Still, knowing the formation of all chart patterns might be a difficult task. But, we have a solution – you can download our basic chart patterns cheat sheet and our advanced chart patterns cheat sheet.
What are the Most Common Classical Chart Patterns
Not surprisingly, there are lots of chart patterns found on candlestick charts. After all, technical analysis was developed around the late 18th century and is still growing and developing.
Yet, some patterns appear on trading charts more frequently than others due to their geometric shapes and the repetitive behavior of financial markets.
So, considering that some of the most common classical chart patterns include:
- Head and shoulders chart pattern
- Triangle Patterns
- Double bottom and double top patterns
- Triple bottom and triple top chart patterns
- Cup and Handle chart pattern
- Pennants or Flag chart patterns
- Rounding bottom and rounding top
- Wedges chart patterns
Below, you can find the full list of all classical price patterns categorized by bullish and bearish classical patterns:
Bullish Classical Patterns
1. Bull Flag Pattern
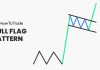
A bull flag chart pattern is a continuation pattern that occurs in a strong uptrend. Similarly to the high tight flag chart pattern, it signals that the prevailing vertical trend may be in the process of extending its range. Bull flags are the opposite of bear flags, which form amid a concerted downtrend.
2. Double Bottom Pattern
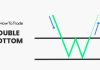
The double bottom pattern is a type of trend reversal pattern found on bar and Japanese candlestick charts. At the basic, much like its identical twin the double top pattern, the double bottom pattern has two bottom levels near the same support line, also known as the neckline, before the price bounces back and starts the next bullish uptrend.
3. Falling Wedge Pattern

The falling wedge pattern is a bullish trend reversal chart pattern that signals the end of the previous trend and the beginning of an upward trend. In the vast majority of cases, the pattern appears after a downtrend and is considered a trend reversal pattern, however, in some cases, it can also be found within a trend and can be interpreted as a continuation pattern.
4, Bullish Divergence Pattern

A divergence is quite a unique phenomenon in technical analysis and trading in general. Basically, it is a ‘disagreement’ between the market price of a certain asset and an oscillator or momentum indicator such as the RSI or the MACD.
5. Ascending Triangle Pattern
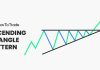
The ascending triangle is a bullish chart pattern formed during an uptrend and signals the continuation of the existing trend. This triangle chart pattern is fairly easy to recognize and assists traders in finding entry and exit levels during an ongoing trend.
6. Bull Pennant Pattern

The bull pennant pattern is a technical analysis indicator that signals the extension of an uptrend. It consists of a single or series of upward price breaks, followed by market consolidation. The bullish pennant is among the strongest continuation patterns, as it frequently precedes up-trend extension.
7. Bullish Wyckoff Pattern

The Wyckoff accumulation method was developed in the 1930s by Richard Wyckoff, an American investor and developer of several technical analysis techniques. Although Wyckoff used bar charts and the method was primarily tested on the stock market index, it can also be applied to any other financial market and can be used on Japanese candlestick charts as well.
8. Bullish Harami Pattern

The bullish harami candle pattern is a Japanese candlestick formation formed at the bottom of a bearish trend and indicates that the trend is about to reverse. In appearance, the pattern consists of two candles one after the other with the first bearish candle having a long body and short upper and lower wicks and the second bullish candle having a very small body.
9. Inverse Head and Shoulders Pattern

The inverse head and shoulders pattern is a bullish candlestick formation that occurs at the end of a downward trend and potentially signals the end of a trend and the beginning of a new upward trend. It is the opposite version of the head and shoulders pattern (which is a bearish reversal pattern) and has a similar structure and logic as the double bottom pattern and the triple bottom pattern.
10. Triple Bottom Pattern
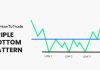
The triple bottom pattern is a bullish reversal chart pattern that is formed after a downward trend and is composed of three consecutive bottoms and a resistance neckline. Following the breakout, there’s often a trend reversal and a bullish trend begins.
11. Bullish Symmetrical Triangle Pattern

A symmetrical triangle is a common chart pattern that appears during an ongoing trend and indicates that the prices are consolidating before moving higher or lower. The pattern is characterized by two converging trendlines, creating the shape of a triangle.
12. Bullish Engulfing Candle Pattern
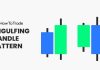
The engulfing candlestick pattern is a chart pattern that signals a possible market reversal. It is a two-candle pattern that may occur in either an uptrend or downtrend on any FX pair and time frame. Engulfing patterns come in two types: bullish and bearish.
13. Three White Soldiers Pattern

The three white soldiers is a bullish candlestick formation seen on candlestick charts that occurs at the bottom of a bearish trend and indicates that the price could soon reverse. As a triple candlestick pattern, the three white soldiers pattern consists of three consecutive bullish candlesticks that appear at the bottom of a downward trend. Traders interpret this charting formation as an indicator of a price reversal and the end of the selling pressure.
14. Bullish Island Reversal Pattern

An island reversal pattern is a formation where price-action gaps separate a group of candlesticks or bars. As in the name, it is a trend reversal pattern that suggests a bullish or bearish trend may be reaching an exhaustion point.
15. Abandoned Baby Bullish Candle Pattern

The bullish abandoned baby is a three-candle formation used by traders to identify the end of a downtrend and may indicate that the market is about to reverse. This bullish reversal pattern is relatively easy to recognize and use as it combines the construction of Doji candlestick and gap trading.
16. Three Inside Up Chart Pattern

The three inside down is a bullish trend reversal chart pattern made of three consecutive candles – a long bearish candle, followed by a bullish green candlestick that is at least 50% of the size of the first candlestick and a third candle that closes above the second candle.
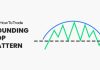
17. Rounding Bottom Pattern
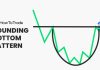
The rounding bottom chart pattern, also known as the saucer bottom pattern, is a trend reversal pattern used in technical analysis to identify the end of a downward trend and the gradual price shift from a bearish to a bullish trend. It is the opposite version of the rounding top bearish pattern and has the shape of the letter U.
18. Bullish Mat Hold Pattern

The Mat Hold pattern is a five candlestick formation that signals the continuation of the ongoing trend. In other words, it is a chart pattern that shows market corrections and take-profit zones before the trend continues to trade in the same direction. The logic behind this pattern is that any trend must have a pullback, retracement, or price correction before the trend continues to move in its initial direction.
19. Bullish Rectangle Chart Pattern

A bullish rectangle is a continuation chart pattern that occurs during an uptrend when prices pause before moving upward. It is a chart formation developed when the price moves sideways, and there’s a temporary equilibrium before the next price movement.
20. Piercing Line Pattern

The piercing line is a two candle chart pattern that appears at the bottom of a downtrend and indicates that the existing trend might change direction. Much like many other trend reversal patterns, technical traders use the piercing pattern to spot new price trends and find buying opportunities.
21. Upside Gap Three Methods Pattern

The upside gap three methods chart pattern is a bullish continuation pattern that appears during an ongoing uptrend. The theory behind this classical chart pattern is that the gap represents the profit-taking mode during an existing trend before the rally continues. The pattern is confirmed as soon as the third candlestick fills the gap and then, the trend is likely to continue in the same direction.
22. Bullish Separating Line Candlestick Pattern

The separating line candlestick pattern is a two-candle chart formation that signals trend continuation. Thus, it is classified as a continuation pattern and a trend-following indicator. It is part of a very limited two candle chart formation group that includes the piercing line pattern, tweezer top pattern, etc.
23. Bullish Breakaway Pattern

The bullish breakaway occurs during a pronounced drop in price. It is a buying signal that suggests a reversal of a bearish trend. A bullish breakaway pattern suggests that a new long position is warranted.
24. Rising Three Methods Pattern
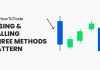
The rising three methods is a bullish continuation candlestick pattern made of one long bullish candlestick followed by three small bearish candles and another large positive candle. It is a bullish continuation formation that helps traders find an entry point during an existing bullish trend.
25. 3 Bar Play Pattern
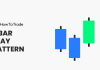
The three-bar play pattern is among the most popular and frequently occurring chart patterns on price charts. Due to the high frequency of this chart pattern, day traders often use it to find trade opportunities and to enter and exit positions.
26. Inside Day Candle Pattern

The inside day candlestick is a price bar that establishes a periodic range between the high and low of the previous trading day. It is a two-bar pattern that is used in a variety of unique trading strategies. Traders interpret the inside day chart pattern as a signal of market consolidation or pending breakout. Its flexibility is conducive to executing many intraday, swing, or inside day trading strategies.
Bearish Classical Patterns
1. Rising Wedge Pattern
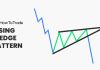
The rising wedge is a bearish chart pattern that occurs at the end of a bullish uptrend and usually represents a trend reversal. The pattern indicates the end of a bullish trend and is a frequently occurring pattern in financial markets. It is the opposite of the falling wedge pattern that occurs at the end of a bearish downtrend and is known as a bullish pattern.
2. Double Top Pattern
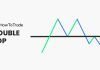
As the name implies, the double top chart pattern has two… tops. Or, in other words – a retest and failure of the previous highest price. It is also very similar to the Adam and Eve chart pattern. In the financial markets, the pattern forms after a bullish trend when a currency pair reaches two consecutive peaks, creating the shape of the “M” letter.
3. Descending Triangle Pattern
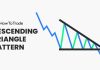
A descending triangle is a bearish chart formation that occurs during a downtrend and indicates that the existing trend is likely to continue. Much like its opposite version, the ascending triangle pattern (that is a bullish continuation pattern), the descending pattern is known as a continuation bearish pattern and helps traders find entry and exit points during a downward trend.
4. Bear Flag Pattern

The bear flag pattern is a price chart formation that suggests a further extension of a prevailing downtrend. Bear flags consist of two parts: the flag pole and the flag. The flag pole is a pronounced downward price movement, while the flag is a period of sideways price action. The bear flag pattern is the opposite of the bull flag pattern and is incorporated into short-side trading strategies.
5. Bearish Wyckoff Pattern
The Wyckoff Accumulation occurs when the price of a particular asset falls or rises following a trend and then enters a period of price consolidation. In this range, prominent players can presumably manipulate the price to buy the asset at a lower price (or higher if the pattern is bearish).
6. Triple Top Pattern

A triple top is a bearish technical analysis chart pattern that occurs after an uptrend and tests the highest price three times before it starts a bearish downward movement. After the price hits the third peak and falls below the neckline, the asset’s price is expected to continue falling and a trend reversal occurs.
7. Bearish Symmetrical Triangle Pattern
The bearish symmetrical triangle is a technical analysis chart pattern that represents price consolidation and signals the continuation of the previous trend. It is one of the most common triangle chart patterns and is widely used by technical traders to identify entry and exit points.
8. Bearish Engulfing Candle Pattern

The bearish engulfing pattern is a two candle formation local to Japanese candlestick price charts. It consists of a positive candlestick (green) followed by a more significant negative candle (red) that completely encapsulates or “engulfs” the previous candle.
9. Bear Pennant Chart Pattern

The bear pennant is a continuation chart pattern that signals that the ongoing trend is likely to continue. It occurs during a bearish trend and indicates a possible extension of a downtrend. Traders use this classical chart pattern to join the existing trend and short sell an asset.
10. Rounding Top Pattern
The rounding top chart pattern is a tool used in technical analysis. It is classified as a reversal indicator. The rounding top forms amid a bullish trend and suggests forthcoming bearish price action. It is the opposite of a continuation pattern as it predicts a trend reversing, not extending. Traders view the rounding top as a signal to short a currency pair or exit a long open position.
11. Three Black Crows Pattern

The three black crows chart pattern is a bearish reversal candlestick pattern. It consists of three consecutive, relatively long bearish candlesticks that occur during an uptrend. Traders view three black crows as a potential shorting signal. Thus, the pattern may be readily incorporated into bullish trend reversal trading strategies.
12. Tweezer Top Pattern
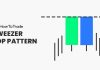
The tweezer top pattern is a bearish reversal pattern. It occurs in a bullish trend when the upper extremes of two candles arise at the same level. Traders view tweezer tops as potential selling opportunities. They are readily discernable on candlestick charts and can be an ideal way of shorting a currency pair.
13. Head and Shoulders Pattern
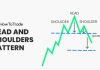
The head and shoulders is a bearish candlestick pattern that occurs at the end of an uptrend and indicates a trend reversal. It is considered a reliable and accurate chart pattern and is often used by traders and investors to predict future price movements.
14. Bearish Island Reversal Pattern
The bearish island reversal pattern forms amid a prevailing uptrend in price. It comprises a positive gap between price action and an island of candlesticks. The bearish island is a signal to sell the market in the hopes of cashing in on a bullish trend reversal.
15. Bearish Mat Hold Pattern
The opposite version of the Mat Hold bullish pattern is the bearish Mat Hold pattern, also known as the inverted Mat Hold pattern. This bearish pattern is made of a first bearish candle followed by three little bullish candlesticks and a fifth long negative candle that closes below the three previous candlesticks.
16. Bearish Parabolic Pattern

Parabolic arc chart patterns are classical formations that signal the possible reversal of a bullish trend. The pattern is named after the “parabola” geometric shape, a curved line with an upward trajectory. Traders view the parabolic formation as one of the strongest uptrend patterns that precede reversal. Accordingly, it is used to sell and open new short positions in FX currency pairs.
17. Downside Gap Three Methods Pattern
The downside gap three methods pattern has the same characteristics as the bullish version, but everything goes the other way around. This means that the downside gap three methods formation appears during a downtrend trend and signals the continuation of a bearish trend.
18. Bearish Breakaway Pattern
The bearish breakaway develops amid a discernable uptrend in price. This formation suggests that a market reversal may be pending and that a bearish price swing is in the offing. The bearish breakaway pattern is a signal to sell the market. Below is an illustration of this formation.
19. Falling Three Methods Pattern
Conversely, the falling three methods is a bearish candlestick pattern characterized by a long first bearish candle followed by three tiny bullish candles and another long bearish candle. The theory behind this chart pattern is that prices do not move in straight lines. Instead, there are wave movements and price corrections during a trend.
20. Descending Channel Pattern

The descending channel pattern is a bearish chart formation. It develops within pronounced downtrends in asset pricing. Traders view descending channels as evidence of weakened strength in the counter currency. Accordingly, it is frequently used to sell a currency pair and join the prevailing market downtrend.
21. 3 Bar Play Pattern
The three-bar play pattern is among the most popular and frequently occurring chart patterns on price charts. Due to the high frequency of this chart pattern, day traders often use it to find trade opportunities and to enter and exit positions.
22. Inside Day Candle Pattern
The inside day candlestick is a price bar that establishes a periodic range between the high and low of the previous trading day. It is a two-bar pattern that is used in a variety of unique trading strategies. Traders interpret the inside day chart pattern as a signal of market consolidation or pending breakout. Its flexibility is conducive to executing many intraday, swing, or inside day trading strategies.
The Free Classical Chart Patterns PDF
If you need something to easily refer to when you’re trading, here’s a concise classical chart patterns PDF. It’s free, by the way:
Risk Disclosure: The information provided in this article is not intended to give financial advice, recommend investments, guarantee profits, or shield you from losses. Our content is only for informational purposes and to help you understand the risks and complexity of these markets by providing objective analysis. Before trading, carefully consider your experience, financial goals, and risk tolerance. Trading involves significant potential for financial loss and isn't suitable for everyone.