


The ascending triangle is a bullish chart pattern formed during an uptrend and signals the continuation of the existing trend. This triangle chart pattern is fairly easy to recognize and assists traders to find entry and exit levels during an ongoing trend.
This article will help you understand how to identify and trade the ascending triangle pattern. Keep reading to find out more about this chart pattern.
- What is the ascending triangle candlestick pattern?
- How to identify and use the ascending triangle candlestick pattern?
- How to trade the ascending triangle candlestick pattern?
- The ascending triangle candlestick pattern – Pros and cons
- Ascending Triangle Pattern (VIDEO)
- Key takeaways
- Frequently Asked Questions (FAQs)
What is the Ascending Triangle Candlestick Pattern?
The ascending triangle is a bullish continuation pattern that appears during an uptrend and indicates that trend is likely to continue. It is one of the most commonly used charting patterns and occurs frequently on price charts.
Being the opposite version of the descending triangle, the ascending pattern is characterized by a flat upper trendline that is used as a resistance level and rising lows trendline.
Also known as the bullish triangle pattern, traders typically use this pattern to identify price consolidation during a bullish trend and enter a long position when the price breaks above the upper resistance horizontal line.
How to Identify and Use the Ascending Triangle Candlestick Pattern?
Generally, the ascending triangle pattern is a bullish formation that occurs during an uptrend and assists traders in finding an upside breakout. However, bear in mind that this charting pattern is rarely recognized perfectly and systematically (like the double bottom pattern and the triple bottom pattern, for example).
Therefore, it requires a certain level of experience and judgment to identify the pattern, in particular the upper flat line that acts as a crucial resistance line.
Still, you don’t need to be a rocket scientist to discover the pattern. Essentially, what you need to do is find a price consolidation during an ongoing trend. Secondly, try to identify the upper resistance line with at least two highs which will help you determine the upper line. Finally, draw a rising trendline with at least two higher lows.
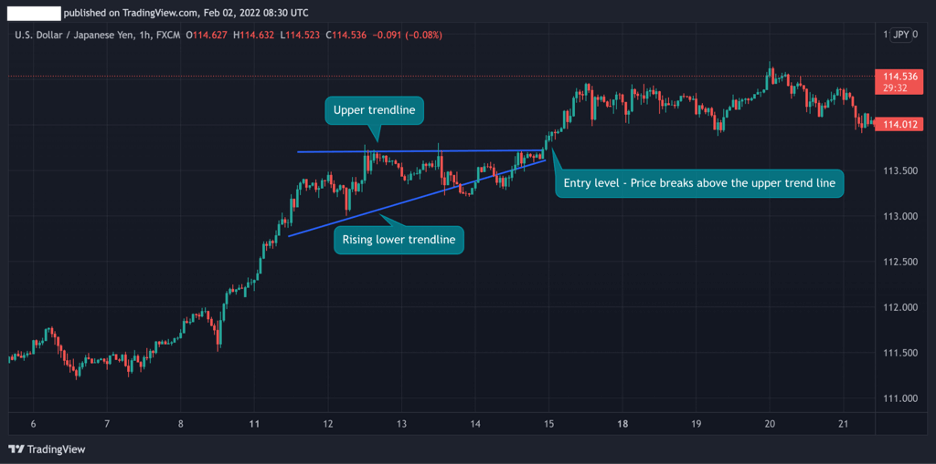
An example is the best way to understand what the pattern looks like on a price chart. In the example below, you can see how the ascending triangle pattern was formed in the USD/JPY 1H chart.
Two highs in the upper trendline, three lows in the rising lower trendline, and a clear price intersection that eventually is broken.
As a result, the pattern is confirmed and the bullish trend continues.
Taking all the information above into consideration, here are the steps you need to follow in order to identify and use the ascending triangle pattern:
- Identify price consolidation during a bullish uptrend
- Draw the upper horizontal line with at least two failed attempts to break the resistance level
- Recognize a rising trendline with at least two rising lows
- Wait for the breakout to occur and place a buying order when the first candle following the breakout closes above the upper line (to confirm the breakout).
- Set a stop-loss order below the upper horizontal line
How to trade the Ascending Triangle Candlestick Pattern?
The ascending triangle charting formation is basically a continuation candlestick pattern, which means you are looking to enter a long position to join the ongoing trend. But, like all candlestick patterns, you need to develop a trading strategy that will help maximize the chances of success.
So, below, we are going to show you two basic but effective strategies to use when you identify the ascending triangle pattern.
1. The Breakout Trading Strategy
Breakout trading is one of the most popular trading techniques that enables traders to use technical indicators and charting patterns. In essence, this trading method involves entering a position when the price moves out of a defined range.
And, like most candlestick patterns, the logic of the ascending triangle pattern is to find a breakout level and enter a position once the price of the asset breaks above or below a certain level.
In the case of the ascending triangle pattern, the upper trend line acts as a resistance level and the pattern is confirmed whenever the price rises above the resistance line.
As shown in the chart below, once the breakout happens, prices immediately rise and the bullish trend continues.
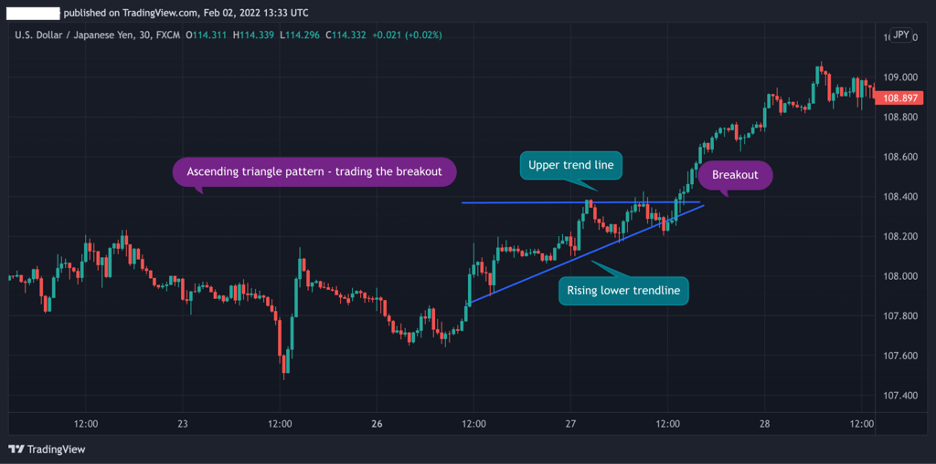
Also, to avoid false breakouts when using this trading strategy, you need to place a stop-loss order below the upper trend line (preferably at the lowest level of the last price action swing).
2. The Measuring Technique for Taking Profit target
Here’s a rule in technical analysis – the longer the direction of a trend is sustained, the larger the price movement following the breakout. This is where the measuring technique comes into play.
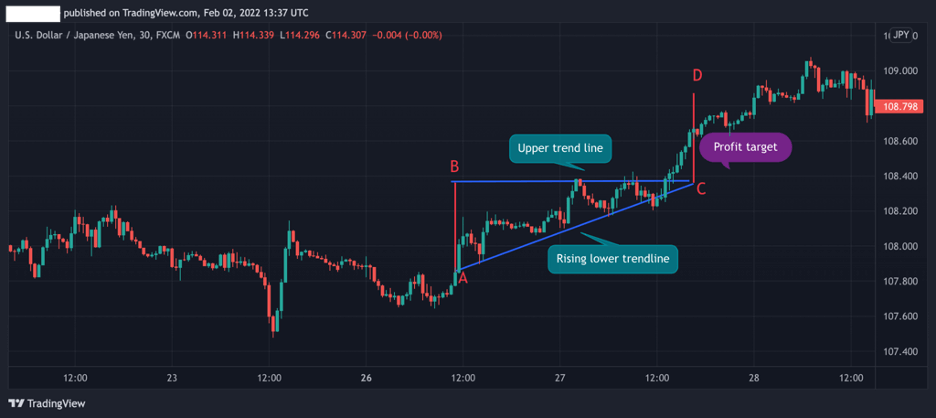
The technique is simple and has one goal – to help you find a profit target. Based on this technique, the height (or distance) from the A to the B point should be equal to the price movement following the breakout.
In the USD/JPY chart below, we used the same example from the above but this time we analyzed the pattern by using the measuring technique.
As you can see, the length of the AB line is equal to the CD line, which may help in identifying the ideal profit target at the point of a breakout.
The Ascending Triangle Candlestick Pattern – Pros and Cons
These are the most common pros and cons of trading the ascending triangle candlestick pattern.
Pros
- Ascending triangles are easy to recognize
- Unlike most chart patterns that indicate a trend reversal, the ascending triangle pattern is a continuation pattern
- By using the measuring technique, take profit targets are clear
Cons
- Rarely appears in perfect formation
- Stop-loss placement is not well defined
- More suited for day traders and scalpers
Everything About the Ascending Triangle Pattern in One Video
Here’s a video by our trading analysts on how to identify and trade the ascending triangle pattern.
Key Takeaways
To sum up, here’s what you need to know about ascending triangle patterns:
- The ascending triangle is part of the triangle patterns group and is a continuation pattern that appears during a bullish uptrend
- The pattern assists traders to find entry levels during an ongoing uptrend
- The ascending chart pattern is comprised of an upper horizontal line with at least two highs, a rising lower trendline with at least two rising lows, and an intersection where traders enter a long position when a breakout occurs
- When using the ascending triangle pattern, a trader will enter a long position at the time of the breakout. To find a profit target, it is advisable to use the measuring technique
Related Candlestick Patterns to the Ascending Triangle
Risk Disclosure: The information provided in this article is not intended to give financial advice, recommend investments, guarantee profits, or shield you from losses. Our content is only for informational purposes and to help you understand the risks and complexity of these markets by providing objective analysis. Before trading, carefully consider your experience, financial goals, and risk tolerance. Trading involves significant potential for financial loss and isn't suitable for everyone.