Chart patterns are graphical representations of repeating price action setups that occur quite often in financial markets. These patterns are formed naturally on trading charts and… there are lots and lots of them. So, for most beginner traders, it’s a serious headache to learn all of these chart patterns and recognize them instantly on a price chart.
Of course, some are easier to identify, while some are more complex. Those that are more complex are advanced chart patterns, and they are, as expected, more difficult to recognize on charts. But everything has a solution. The only thing a beginner trader needs at the beginning of a trading journey is to survive the first few months and learn as much as possible. And an excellent tool to do that is using cheat sheets.
So, to help you take the first steps in the right direction, here, we share our advanced cheat sheet candlestick patterns pdf so you can use them whenever you need.
Advanced Cheat Sheet Candlestick Patterns PDF
Below, you can download for free our advanced candlestick patterns PDF categorized into advanced bullish bearish candlestick patterns:
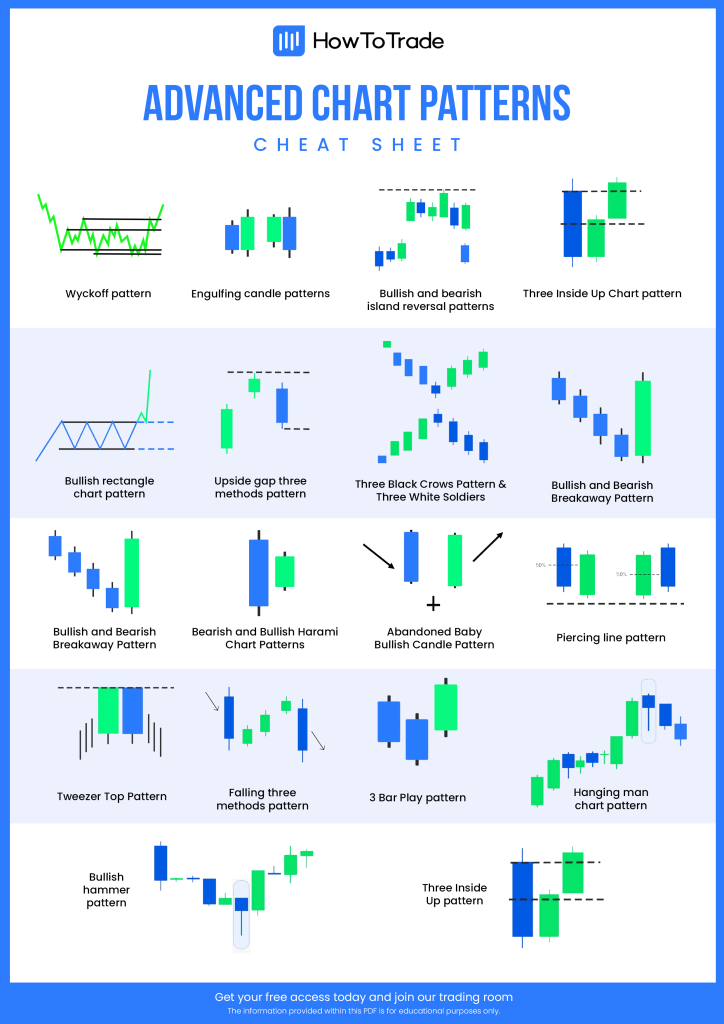
Advanced Cheat Sheet Candlestick Patterns PDF [Download]
What are Advanced Candlestick Patterns?
In essence, advanced chart patterns are not different from standard chart patterns. They signal that the price of an asset is likely to move in a specific direction based on a repetitive pattern and past data. To make things more organized, you need to remember that chart patterns are categorized into:
- Bullish reversal patterns
- Bearish reversal patterns
- Bullish continuation patterns
- Bearish continuation patterns
Now, the only difference is that advanced candlestick patterns are a bit more complex to recognize on a price chart than basic candlestick price action patterns. They often have a complex structure and more strict rules on where and when to enter and exit a trade.
For example, a Doji candlestick pattern is a basic chart pattern as it is a single candle pattern that can be easily recognized on candlestick charts. However, other patterns require a more in-depth understanding of the pattern’s structure, meaning, and how to use it properly.
Such an example is the Wyckoff pattern, which is not only a chart pattern but also a theory. When you trade a financial instrument using the Wyckoff pattern, you should know how to locate it and use it to find trading ideas. Another advanced chart pattern is the Parabolic pattern. Once again, when trading this bearish candlestick pattern, you need to know how to identify the formation of the pattern naturally and know where and when you should enter and exit a position.
Notably, harmonic chart patterns can also be classified as advanced candlestick patterns. Learning harmonic chart patterns is far more complex and not favorable for all traders; however, they are also arguably the most accurate and reliable chart patterns, especially for short-term trading techniques. So, if you are keen to learn how to use harmonic chart patterns, we suggest you read our harmonic chart pattern guides and download our harmonic patterns candlestick cheat sheet.
Overall, every chart candlestick pattern you learn will be valuable if you rely on technical analysis to predict price movements in stock, commodity, or forex trading. Nonetheless, you must always use other technical analysis tools to confirm the trade. Those include Fibonacci support and resistance levels, technical indicators, and trend lines.
10 Most Essential Advanced Candlestick Patterns
The following advanced candlestick patterns are the most common to look out for when using technical analysis to trade financial assets.
1. Bullish and Bearish Wyckoff Pattern
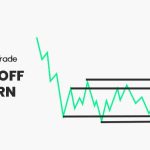
Developed in 1930 by Richard Wyckoff, the Wyckoff candle pattern is one of the most valuable technical analysis methods to predict future price movements and find market trends. According to the Wyckoff theory, price action moves in a cycle of 4 phases – markdown, accumulation, markup, and distribution.
2. Bearish and Bullish Engulfing Candle Pattern
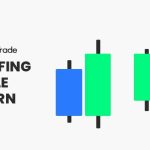
The bullish and bearish engulfing candlestick pattern is a chart pattern that signals a possible market reversal. It is a two-candle pattern that may occur in either an uptrend or downtrend on any instrument and time frame. Engulfing patterns come in two types: bullish and bearish.
3. Bullish and Bearish Island Reversal Pattern
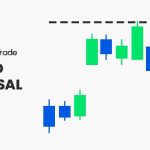
At its core, the bullish island reversal formation suggests that the price action trajectory is due to a change in course. Accordingly, it is classified as a reversal indicator. The Island reversal patterns come in two types: bullish and bearish.
4. Three Inside Up Chart Pattern
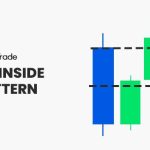
The three inside down is a bullish trend reversal chart pattern made of three consecutive candles – a long bearish candle, followed by a bullish green candlestick that is at least 50% of the size of the first candlestick and a third candle that closes above the second candle.
5. Bullish Rectangle Chart Pattern

The bullish rectangle is a continuation candlestick pattern that occurs during an uptrend when prices pause before continuing upward. It is a chart formation developed when the price moves sideways, creating a range, and there’s a temporary equilibrium before the next price movement. Along with the bearish version, they are known among the most accurate continuation candlestick patterns in technical analysis.
6. Upside Gap Three Methods Pattern
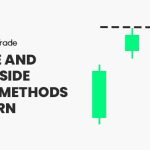
The upside gap three methods is a bullish continuation chart pattern that appears during an ongoing uptrend. At basic, the theory behind this classical chart pattern is that the gap represents the profit-taking mode during an existing trend before the rally continues. The pattern is confirmed as soon as the third candlestick fills the gap, and then, the previous trend is likely to continue in the same direction.
7. Three Black Crows Pattern & Three White Soldiers

The three black crows and three white soldiers chart patterns are bearish or bullish reversal candlestick patterns. Both consist of three consecutive, relatively long candlesticks that occur during an uptrend or downtrend. Traders view three black crows as a potential reversal signal.
8. Bullish and Bearish Breakaway Pattern
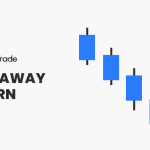
Bullish and bearish breakaway patterns are multi-candle chart formations that suggest a market reversal may occur. An actual breakaway is a five-candlestick formation that occurs in either an upward or downward trend and signals a trader to enter a position in the opposite direction.
9. Rising and Falling Window Pattern
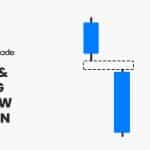
The rising and falling windows are chart patterns that consist of two candles in the same direction with a gap between them. As a gap in trading is a strong sign of high volatility and new developments in the market, these patterns are considered reliable and accurate in predicting the next price movement.
10. Bearish and Bullish Harami Chart Patterns

The bearish and bullish harami candle pattern is a Japanese candlestick formation formed at the bottom (bullish harami) or top (bearish harami) of an ongoing trend and indicates that the trend is likely to reverse. In appearance, the pattern consists of two candles, one after the other, with the first candle having a long body and short upper and lower wicks and the second candle having a very small body.
Final Word
Japanese candlestick patterns are an excellent way to predict future price movements. They provide signals that will help you understand price action, and ultimately, find trading patterns.
Therefore, you should equip yourself with knowing as many patterns as possible to get a better grasp of how assets’ prices move and learn how to analyze the markets correctly. To start, download our basic Japanese candlesticks chart patterns cheat sheet where you can find the most widely used and conventional candlestick chart patterns. Additionally, use our free advanced candlestick patterns cheat sheet above to expand your chart patterns knowledge.
Risk Disclosure: The information provided in this article is not intended to give financial advice, recommend investments, guarantee profits, or shield you from losses. Our content is only for informational purposes and to help you understand the risks and complexity of these markets by providing objective analysis. Before trading, carefully consider your experience, financial goals, and risk tolerance. Trading involves significant potential for financial loss and isn't suitable for everyone.