The rising wedge is a bearish technical analysis pattern that indicates trend reversals, breakouts, or continuations.
In this article, we are going to help you understand what is the rising wedge pattern, and how to trade currency pairs using this effective charting pattern.
What is the Rising Wedge Pattern?
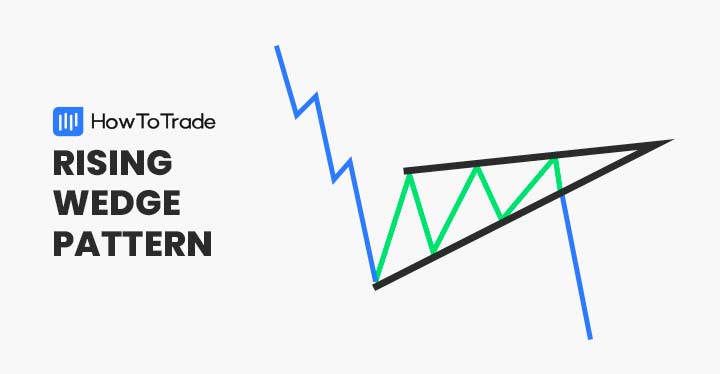
The rising wedge is a bearish chart pattern that occurs at the end of a bullish uptrend and usually represents a trend reversal.
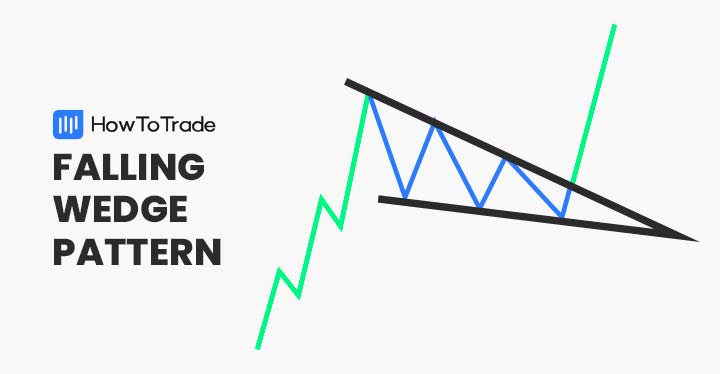
The pattern indicates the end of a bullish trend and is a frequently occurring pattern in financial markets. It is the opposite of the falling wedge pattern that occurs at the end of a bearish downtrend and is known as a bullish pattern.
Traders that spot rising wedge patterns can interpret it as a price consolidation formed at the end of a medium-long market trend. Since this pattern indicates the slowing momentum of the previous trend, traders normally will take a short-selling position or exit a position.
How to Identify and Use the Rising Wedge Pattern in Trading?
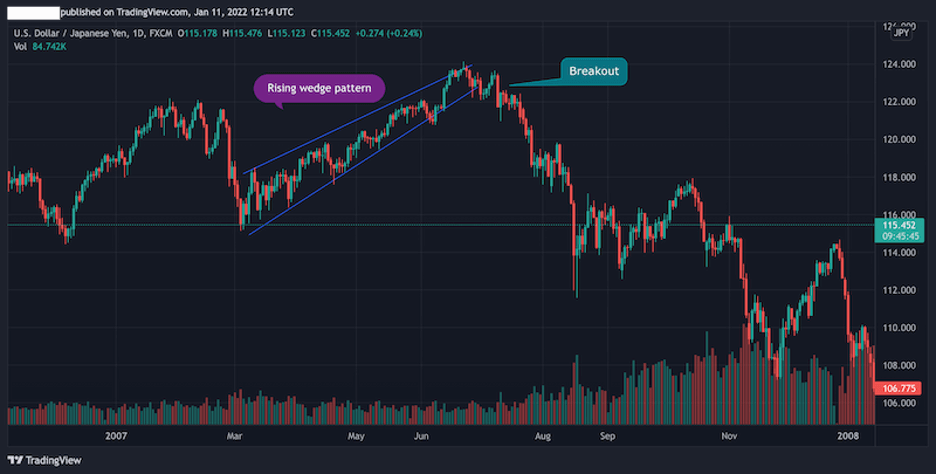
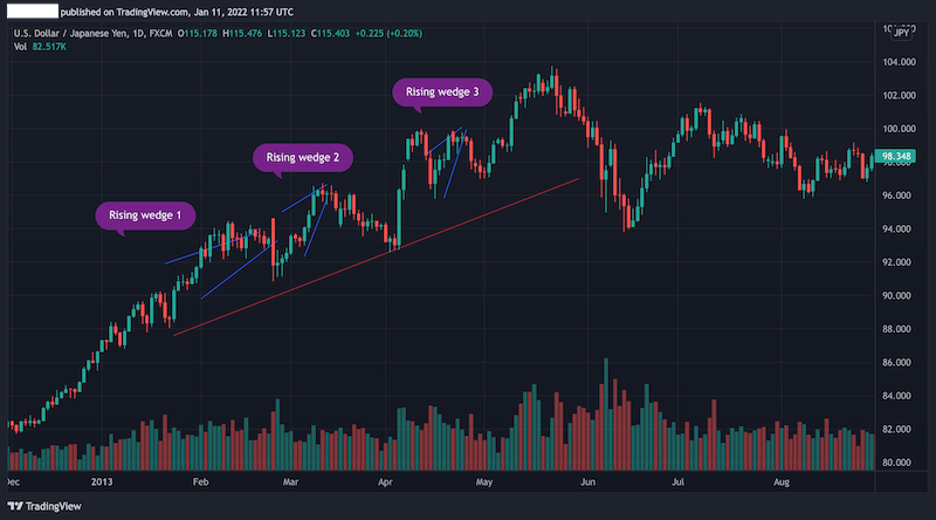
The rising wedge is a pure price consolidation pattern that appears at the end of an uptrend. As you can see in the USD/JPY daily chart below, the pattern can be identified by a contracting price range (two converging trend lines) during a bullish uptrend.

To make things clear and organized, you are advised to follow the steps below in order to identify and use the rising wedge bearish reversal pattern in trading.
- Identify an existing trend in a currency pair
- Draw support and resistance two trend lines along with the highs and lows of the trend.
- Wait for a price consolidation and the contraction of support and resistance lines
- Place a sell order once the rising wedge appears and the price break below the support line
- Set a stop-loss order at the same support trend line
How to Trade the Rising Wedge Pattern?
As we mentioned, the rising wedge pattern can be identified when the price consolidates and the trend lines narrow and become closely aligned. This signals a slowing trend and a price trend reversal.
However, the confusion with the rising wedge pattern is that it is difficult to accurately determine whether it is a continuation or trend reversal. This makes rising wedges among the most reliable patterns in technical analysis but also among the most complicated trading strategies you can find in financial markets trading.
With that in mind, let’s see how these different rising wedge formations look on trading charts.
1. Reversal Trend
In most cases, the rising wedge pattern occurs at the end of an uptrend and signals that the buying pressure is not likely to continue.
To identify reversal, you will have to wait for at least one candlestick to be completed after the trend line breakout and confirm the trend reversal with other technical indicators.
For that matter, some of the most useful trend reversal indicators include the Relative Strength Index indicator, moving averages, and the MACD (Moving Average Convergence Divergence).
The best of all would be to draw Fibonacci support and resistance levels. Then, whenever you identify a rising wedge pattern near one of the Fibonacci levels, you can take it as a strong indication for reversal rather than correction.
2. Trend Continuation
Generally, the rising wedge pattern always indicates a reversal in currency pair prices. However, in some cases, you’ll see that this pattern can also be used to identify a correction in a trend and thus, the continuation of the primary trend in the market.
Let’s use an example. In the chart below, you can see how the rising wedge pattern looks in a bullish long trend. In this case, the market is still in a bullish bias and the ascending pattern simply indicates corrections in the trend.
When this happens and the rising wedge is formed after an uptrend by two converging trend lines, you simply need to wait until the price reaches the bottom support trend line and make it a trade entry-level.
What are the Rising Wedge Pattern Pros and Cons?
Below you can check the pros and cons of trading the rising wedge pattern.
Pros
- Easy to identify
- A reliable trend reversal indicator
- Occurs frequently in the financial market
- Works well with stop-loss order and risk-reward ratio
Cons
- Requires the use of other technical indicators
- Difficult to spot whether the rising wedge pattern indicates a reversal or continuation pattern
Key Takeaways
In conclusion, here are the key takeaways:
- The rising wedge pattern is a frequently occurring pattern in technical analysis. It is a bearish pattern that appears at the end of a bullish trend when you are able to spot the support and resistance trend line connecting
- The pattern can signal a trend reversal or continuation, depending on the sentiment in the market
- It is best to combine rising wedge patterns with other technical analysis indicators – MA, RSI, MACD, trading volume, and Fibonacci retracement levels
- When using the rising wedge pattern, it is best to wait for the next candlestick after the breakout to be completed and then to place the stop-loss order at the bottom rising wedge support trend
Risk Disclosure: The information provided in this article is not intended to give financial advice, recommend investments, guarantee profits, or shield you from losses. Our content is only for informational purposes and to help you understand the risks and complexity of these markets by providing objective analysis. Before trading, carefully consider your experience, financial goals, and risk tolerance. Trading involves significant potential for financial loss and isn't suitable for everyone.