


The three inside up is a three-candlestick pattern that appears at the end of a downtrend and signals the beginning of a new upward trend.
Being one of the most common and frequently occurring triple candlestick patterns in technical analysis, getting familiar with this charting pattern is crucial in trading.
In this post, we’ll explore this chart pattern and show you how to use it in forex trading.
What is the Three Inside Up Candlestick Pattern?
The three inside down is a bullish trend reversal chart pattern made of three consecutive candles – a long bearish candlestick pattern, followed by a bullish green candlestick that is at least 50% of the size of the first candlestick and a third candlestick that closes above the second candle.
Similar to the bullish 3 bar play pattern, the three inside up pattern shows that the current momentum is weakening, and the possibility of a trend reversal is high. As the pattern signals a price transition for an upward trend, traders who identify the three inside-up pattern will be looking to enter a long buy position. Like many other candlestick patterns, the three inside-up formation occurs frequently on candlestick charts and is often used by short and long-term traders.
How to Identify the Three Inside Up Pattern in Trading?
Identifying the three inside up pattern is relatively simple. As long as you are familiar with the basics and the technicals of this pattern, you’ll be able to recognize it quickly.
First, you need to remember that three inside-up patterns appear at the bottom of a downtrend near support levels. Secondly, you need to identify the two candle formations of a first long bearish candlestick and a second shorter bullish candlestick (at least 50% the size of the first candle).
Finally, after identifying the two candlestick pattern, the last step in identifying the three inside-up pattern is to get the confirmation third candle. This is a large bullish candlestick pattern that closes above the closing price of the second candlestick. Let’s see an example of the three inside up chart pattern.

As seen in the USD/JPY 1H chart above, the three inside up pattern appears at the end of a downtrend and is made of three candlesticks that signal the beginning of a new trend.
The first candle is a long bearish candle with a real body. The second candle is bullish, with opening and closing prices within the range of the first candle. Finally, the last bullish candle, which is also the confirmation candle, closes above the second candle’s closing price.
Taking the above into account, you need to follow these steps to identify and trade the three inside up chart pattern:
- Identify a triple candlestick pattern at the bottom of a downward trend – first long bearish candle, second bullish candle that closes at least half of the size of the first candle, and third bullish candle that closes above the second candle
- Add additional technical analysis tools to confirm the trend reversal
- Enter a long buying position
- Set a stop-loss below the lowest level of the first candle pattern and take the profit target at the highest level of the previous trend
How to Trade the Three Inside Up Pattern (Trading Strategies)
Generally, when the three inside-up pattern appears after a downward trend, traders will be looking for the right market level to enter a long buying position. However, since this classical chart pattern is normally used as a lagging indicator, most technical analysis traders utilize another trading technique for deciding when to enter a trade, set a stop loss rate, and take profit targets.
Below, we will show two of these methods to help you confirm the three inside-up trend reversal patterns and find the ideal level to get in and out of a position.
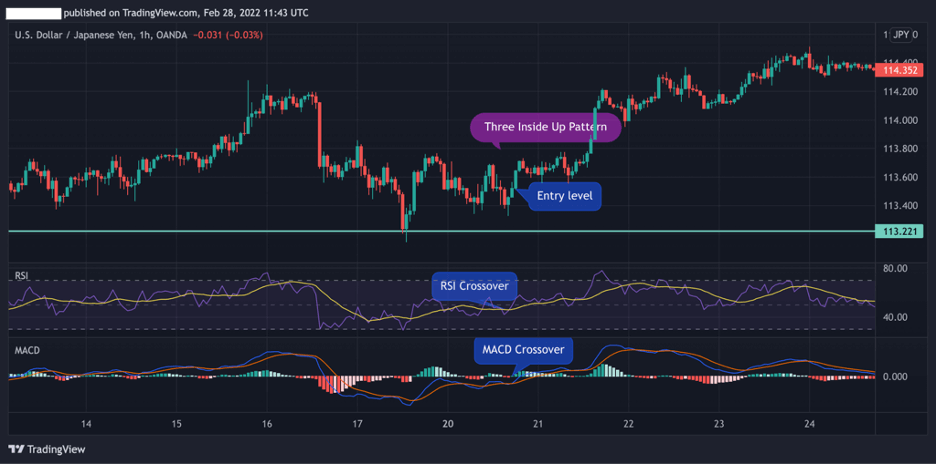
Using Trend Reversal Indicators – MACD and RSI
As we mentioned, the three inside up pattern should not be traded in isolation. Instead, it should be used as another indicator to enter a position and combine it with other confirmation tools.
For example, two of the most popular and effective trend reversal indicators are the RSI and MACD. By using these indicators, you can get valuable information about the strengths or weaknesses of the ongoing trend.
The chart below shows how the two trend reversal indicators confirm the price reversal. The RSI crossover occurs slightly after the second candle, while the MACD crossover occurs even before. In this case, you need to wait for the third confirmation candle to over and close above the second candle.
And then, you can enter a trade.
Adding Fibonacci Retracement Levels
Another trading strategy to use in combination with the three inside up pattern is adding Fibonacci retracement levels. As a fan of Fibonacci levels, I would recommend adding these levels at all times, especially when you can find the market price between the highs and lows of previous market trends.
In essence, Fibonacci retracements are hidden support and resistance levels in the market. Therefore, when identifying trend reversal patterns such as the three inside-up pattern, these Fibonacci levels can help traders find a market entry level and set a level for stop loss and profit.
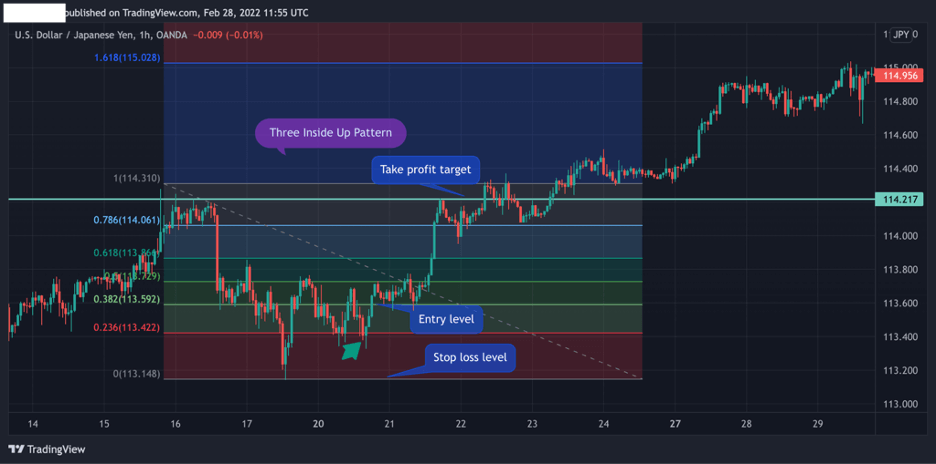
To use Fibonacci retracements, you need to draw them from the lowest to the highest level of the previous trend. As seen in the chart below, we have drawn Fibonacci retracement levels from the highest to the lowest level of the prior trend.
First, the middle candle intersects with the 23.6% Fibonacci level, which can be the first entry-level. However, for those who wish to use additional confirmation tools, the completion of the third candle and the rise above the 38.2% Fibonacci level – both provide the ideal market entry level.
Further, stop loss should be placed at the lowest of the previous trend, and take profit is located at the highest level of the previous trend.
The Three Inside Up Pattern – Pros and Cons
These are the most common pros and cons of trading the three inside up chart pattern:
Pros
- Easy to identify
- The three inside up is a common chart pattern
- Works well with Fibonacci retracement levels
- It can be used by short and long term traders
Cons
- The pattern is not entirely accurate on its own – it needs additional confirmation tool
- May generate false signals
Key Takeaways
Below, you can find the key takeaways about three inside up candlestick patterns:
- The three inside up is a bullish reversal pattern made of a first large bearish candle, a smaller middle bullish candle, and another positive bullish candle that closes above the closing price of the second candle
- The pattern indicates that the price action is about to reverse and helps traders find entry-level for a long position
- When trading the three inside up pattern, a trade will enter a position at the closing price of the third candle with a stop loss below the lowest level of the first candle and take the profit target at the highest level of the prior trend
- It is best to use other technical analysis indicators and Fibonacci retracement levels to confirm the trend reversal
Three Inside Up Candlestick Pattern FAQs
What does the three inside up pattern mean?
The three inside up is a bullish trend reversal charting formation, which typically indicates the end of an ongoing bearish trend and signals a potential trend reversal. It is the opposite version of a three inside down pattern, which appears at the top of a bullish trend and is a bearish reversal pattern. The three inside up formation is also quite similar to other trend reversal triple candlestick patterns like the abandoned baby bullish pattern, the three black crows pattern, and the bullish harami chart pattern.
What is the difference between the three inside up candlestick patterns and the morning star chart pattern?
There’s a similarity between the three inside up pattern and the morning star chart pattern – they both are three candle patterns with the same formation and implication. With that being said, there’s one significant difference between the two. While in the morning star pattern the middle candle is a Doji candlestick, in the three inside up pattern the middle candle has a relatively long body. Consequently, the three inside up is considered more accurate than the morning star and less prone to false trend reversal indications.
Risk Disclosure: The information provided in this article is not intended to give financial advice, recommend investments, guarantee profits, or shield you from losses. Our content is only for informational purposes and to help you understand the risks and complexity of these markets by providing objective analysis. Before trading, carefully consider your experience, financial goals, and risk tolerance. Trading involves significant potential for financial loss and isn't suitable for everyone.


