Within the realm of technical analysis, chart patterns are popular tools. Of course, not all are alike, and some are more complex than others. In this article, we will teach you how to recognize, interpret, and trade this variety of geometric price patterns.
What Are Harmonic Chart Patterns?
Harmonic chart patterns are formations that represent the comprehensive structure of price action. They may be constructed in various ways, using technical tools such as Fibonacci ratios, retracements, and extensions. A few of the most popular are the Gartley pattern, butterfly pattern, bat pattern, and crab pattern.
Traders use harmonic chart formations in a variety of ways. The most common is within the context of retracement and continuation patterns. In this way, a harmonic pattern may be a viable buy or sell signal.
What are the 9 Most Common Harmonic Chart Patterns
Overall, there is quite a large number of harmonic chart patterns to choose from. Each of these has its own rules, Fibonacci ratios, and a specific formation. In this section, you can find seven of the most common harmonic pattern guides including a detailed explanation of how to identify and trade each harmonic pattern.
1. Butterfly Pattern
The butterfly harmonic pattern is a reversal chart pattern that appears at the end of a trend move. It is known as one of the most advanced and complicated harmonic patterns used by traders to identify trend reversals.
2. Gartley Pattern
The Gartley pattern is a harmonic chart formation that relies on the Fibonacci sequence for construction. The formation was intended for the stock market but may be applied to any instrument or product. Gartley patterns are the most commonly used harmonic patterns in technical analysis. They furnish the trader with price targets for taking profits and locating stop losses.
3. Diamond Pattern

The diamond pattern is a reversal indicator that signals the end of a bullish or bearish trend. It is most commonly found at the top of uptrends but may also form near the bottom of bearish trends. This leads to two distinct diamond patterns: the bullish diamond pattern and the bearish diamond pattern. Traders view the diamond top and bottom as potential trading opportunities.
4. XABCD Pattern
Developed by Harold McKinley Gartley, the XABCD is a trend reversal pattern with five separate points (XABCD) and four legs (XA, AB, BC, and CD). The pattern can be a bullish pattern or a bearish pattern, and, in any matter, it indicates that the price action is about to reverse.
5. AB=CD Pattern
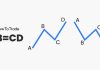
The AB=CD is a basic harmonic chart pattern traders use to identify trend reversals and find trading opportunities. Among the various harmonic candle patterns, it is considered the simplest harmonic pattern of all, but only if you know how to use and trade it correctly. Read on to learn more about the ABCD harmonic chart pattern.
6. Cypher Harmonic Pattern
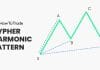
The Cypher harmonic pattern is a technical analysis formation indicating a price-action reversal. The pattern was discovered by Darren Oglesbee and is known as a relatively advanced pattern formation. In structure, the Cypher pattern is similar to the butterfly harmonic pattern; however, the Cypher is not a very common chart pattern due to its unique Fibonacci ratios.
7. Shark Harmonic Pattern
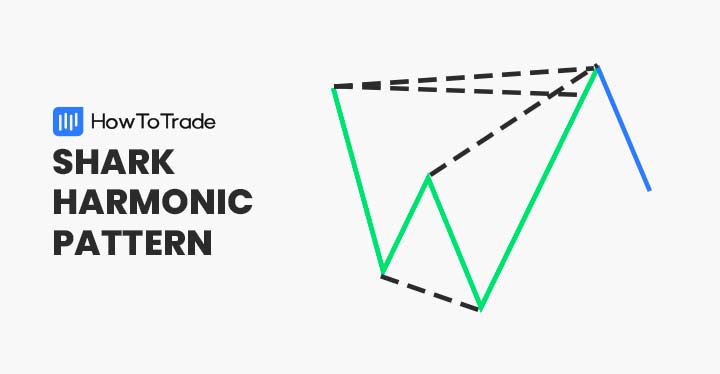
The shark candlestick pattern is a new harmonic chart pattern discovered in 2011 by Scott Carney that indicates a trend reversal possibility. So far, the pattern has been proven highly accurate and can be used by traders to identify trend reversals and find successful trading opportunities.
8. Bat Harmonic Pattern
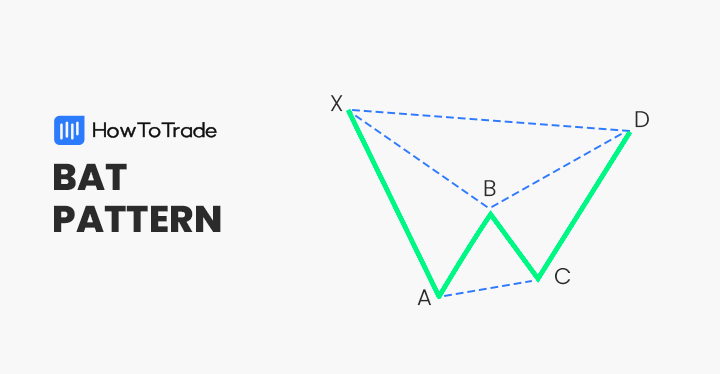
The bat pattern is known as the most accurate of all harmonic chart patterns; however, using it requires the consideration of a range of factors, including the Fibonacci measurements, entry levels, and profit targets.
9. Crab Harmonic Pattern
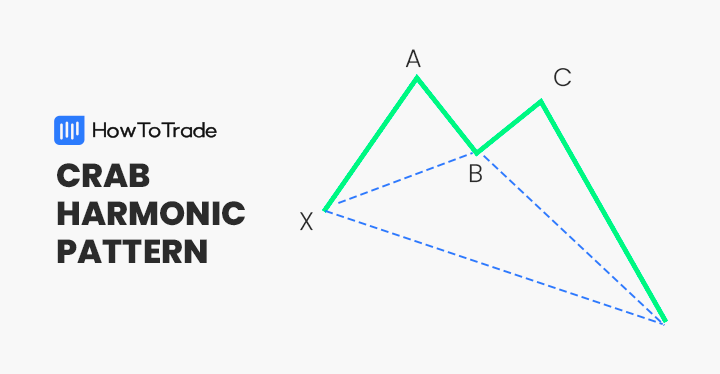
The crab chart pattern is a unique harmonic candlestick formation seen on charts that help traders find trend reversal and trade opportunities. With its unique Fibonacci ratios, the crab harmonic pattern gives a clue about the beginning of a new market trend and like many other harmonic price patterns, it is considered a very accurate and reliable chart pattern.
How do You Identify and Use the Harmonic Patterns?
Compared to other less complex patterns, using harmonic patterns is more involved. While multi-candle formations such as the three black crows or evening star require some legwork, harmonic price patterns take a bit more effort. Therefore, at the beginning, you better use our harmonic chart patterns cheat sheet. This will help you learn the formation and strategy of each harmonic chart pattern.
The process below outlines how to trade harmonics:
- Identify a bullish or bearish directional move in price.
- Locate key retracement levels with Fibonacci ratios
- Construct the pattern
- Interpret the reversal or continuation pattern
- Buy or sell the market
Geometric Patterns
Harmonic price formations are geometric price patterns. Accordingly, they consist of multiple parts and, when combined, constitute a whole. The result is a pictorial representation of price action.
The purpose of harmonic patterns is to aid traders in identifying trends, continuations, and reversals. Thus, a bearish pattern is viewed as a selling opportunity; a bullish pattern suggests that buying is appropriate.
Fibonacci Sequences
The Fibonacci sequence is a foundational element for harmonic pattern recognition. Fibonacci retracements are a standard device used to measure the magnitude of price trends, pullbacks, and reversals.
The critical retracement levels are 38.2%, 61.8%, and 78.3%. These inflection points may be used to quantify a harmonic continuation or reversal pattern. Using these levels, one can pinpoint market entry, stop loss, and profit target location.
Bullish Or Bearish?
Harmonic chart formations may be classified in two ways: bullish or bearish. A bullish formation suggests either the reversal of a downward trend or the extension of a prevailing upward trend. Bearish patterns signal a pending reversal of an upward trend or the continuation of a bearish downward trend.
Traders view bullish harmonic patterns as signals to buy a currency pair. Conversely, bearish formations are used to sell a given currency pair. In either case, the patterns may be traded in a trend following capacity or treated as a potential reversal zone.
Traders use harmonic chart formations in a variety of ways. The most common is within the context of retracement and continuation patterns. In this way, a harmonic pattern may be a viable buy or sell signal.
How to Trade the Three Most Common Harmonic Chart Patterns?
In the live market, there are many different types of harmonic patterns. The Gartley, Butterfly, and ABC formations are three of the most popular.
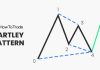
The Gartley
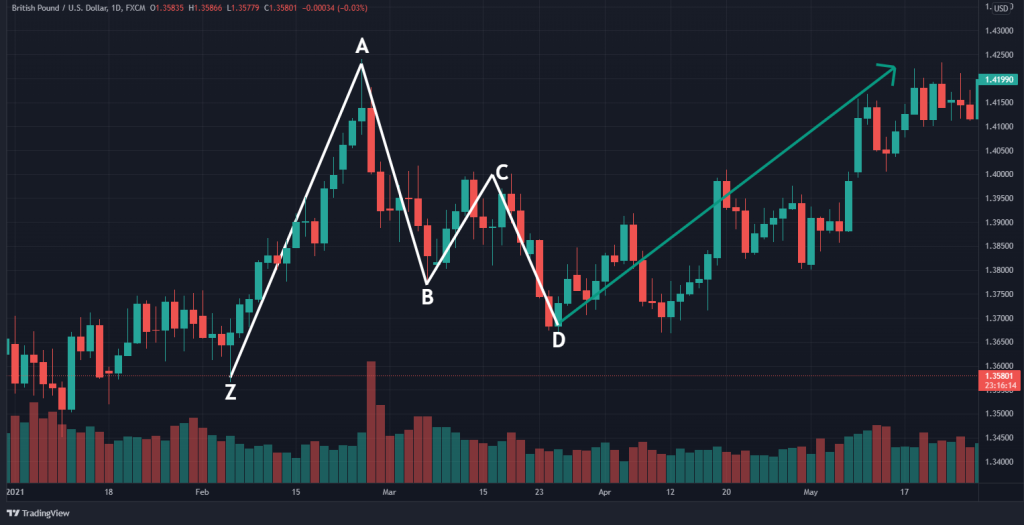
The Gartley chart pattern consists of a directional move and subsequent peaks and troughs. Each formation comprises four legs: Z-A, A-B, B-C, and C-D. Gartleys are similar to the traditional ABCD pattern and maybe either bearish or bullish. The chart below gives us a good look at the Gartley harmonic pattern.
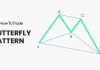
The Butterfly
The butterfly harmonic chart pattern is used to project market reversals and brand new trends. It is similar to the Gartley in that it consists of four legs: X-A, A-B, B-C, and C-D. However, instead of C-D falling within X-A, it extends above or below the upper or lower extreme (X).
Below is an illustration of the butterfly harmonic formation.
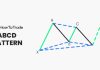
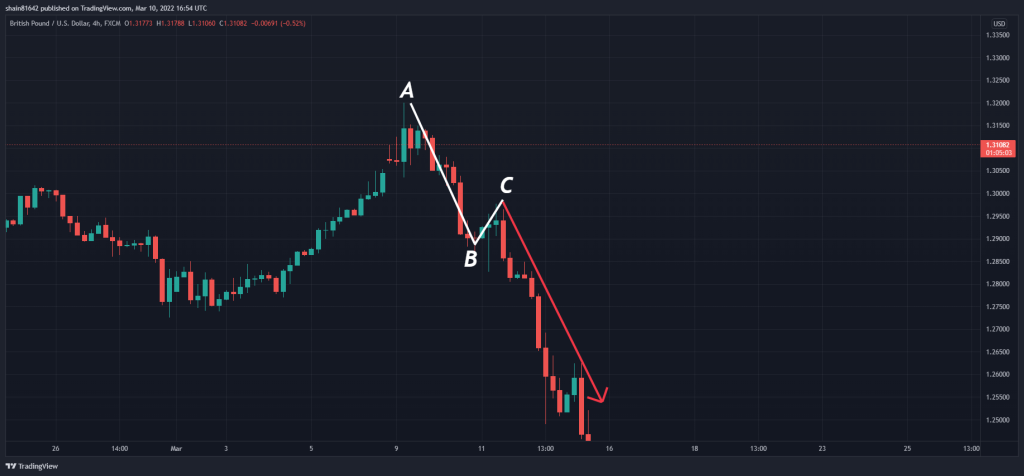
The ABC
The ABC pattern also referred to as the AB=CD, falls within reversal harmonic patterns. The formation consists of an A-B directional move and a B-C retracement. As a retracement, the B-C leg typically exists as a 38% or 61.8% pullback of the A-B price swing.
The following chart is an illustration of the ABC chart pattern.
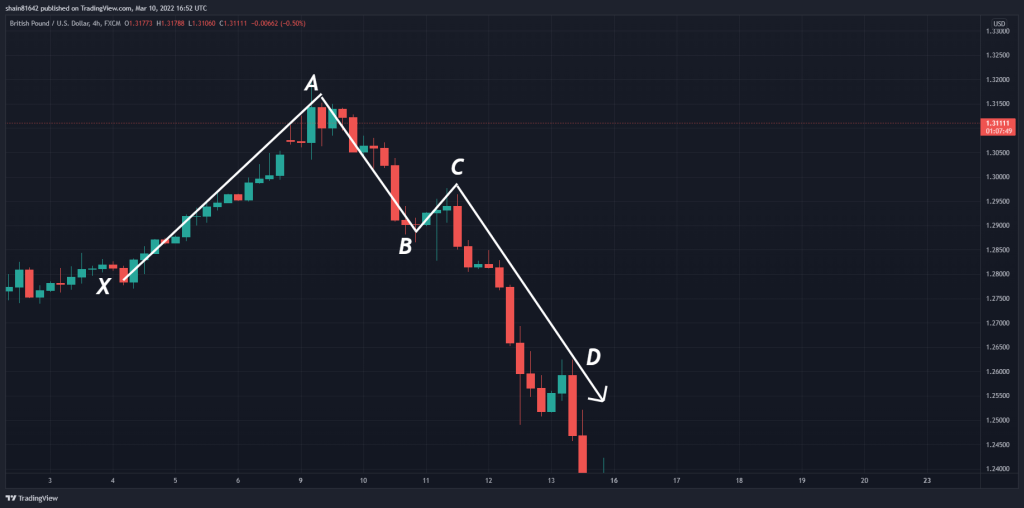
Trading Example
The following example is an outline of the harmonic trading process. Accordingly, the GBP/USD chart below gives us a look at how one trades the ABC formation.

Here’s how this GBP/USD harmonic trade was executed:
- A bearish directional move in price was observed.
- The ABC pattern was constructed.
- A sell entry was placed at 1.2885.
- Stop-loss was placed at 1.3203.
- The profit target is 1.2567 in adherence to a 1:1 risk vs. reward ratio.
- Upon the profit target being hit, a 318 pip profit is realized.
What’s the Difference Between the Harmonic Bearish Vs. Bullish Pattern
Harmonic chart patterns come in many shapes and sizes. And, they may act as both bullish and bearish signals. When trading harmonic patterns, it pays to remember the following relationships:
- A bullish harmonic pattern develops during a downtrend. It is a signal to buy the market.
- A bearish harmonic pattern is present during an uptrend. It is a signal to sell the market.
Harmonic formations may suggest reversals or the end of a pullback in price. In this way, bullish and bearish patterns may be used in trend-following or reversal strategies.
What are the Harmonic Trading Pros and Cons?
Pros
- Commonly found in all markets on all time frames
- The harmonic pattern is a retracement and continuation pattern – That works well in reversal and trend-following strategies
- Can produce significant profits in volatile markets
Cons
- Take significant attention to construct
- May be challenging to recognize quickly on shorter timeframes
- Weekly and daily harmonic patterns can be expensive to trade properly
Key Takeaways
- Harmonic chart patterns consist of multiple legs that make up geometric formations. They include a directional move in price followed by a series of peaks and troughs
- The structure of harmonics may be determined in various fashions. One of the most common is Fibonacci ratios
- There are many different types of harmonic patterns. A few of the most common are the Gartley, crab pattern, and bat pattern
Risk Disclosure: The information provided in this article is not intended to give financial advice, recommend investments, guarantee profits, or shield you from losses. Our content is only for informational purposes and to help you understand the risks and complexity of these markets by providing objective analysis. Before trading, carefully consider your experience, financial goals, and risk tolerance. Trading involves significant potential for financial loss and isn't suitable for everyone.