


The piercing line is a two-candle chart pattern that appears at the bottom of a downtrend and indicates that the existing trend might change direction. Much like many other trend reversal patterns, technical traders use the piercing pattern to spot new price trends and find buying opportunities.
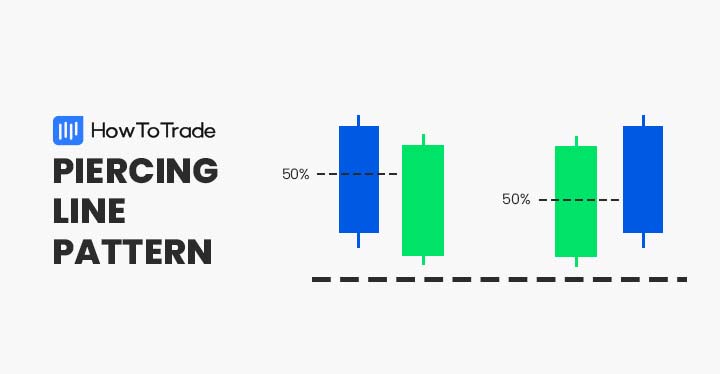
- The pattern is made of two candles – first long bearish candle and second long bullish candle that gaps down and closes above the 50% length of the first candle
- To trade the piercing candlestick pattern, you better confirm the reversal with other tools such as RSI, MACD, and Fibonacci levels
- Once identified, traders typically enter a buying position when the third candle is completed and closes above the second bullish candlestick
- Stop-loss is placed below the lowest level of the bullish candlestick. Take profit is located at the highest point of the prior trend or at one of the following Fib levels
In this article, we’ll show you how the piercing line pattern is formed on candlestick charts, what tools and trading strategies you need to use when identifying the pattern, the pros and cons, and more.
What is the Piercing Line Candlestick Pattern?
The piercing line is a bullish reversal candlestick pattern found at the end of a bearish trend that helps traders find potential reversal zones.
Being one of the few two candlestick patterns, the piercing line pattern consists of two consecutive candles with a first bearish candlestick and a second bullish candle having long bodies and short lower and upper wicks. Further, the close of the second bullish candle must be above 50% of the preceding bearish candle.
How to Identify the Piercing Line Pattern in Trading?
There are several things to keep in mind to identify the piercing line pattern. First, the pattern appears at the bottom of a downward trend. Secondly, it includes a long bearish candle followed by a long bullish candle that must be at least 50% of the length of the previous candlestick.
Finally, the bullish candlestick must have an opening price that is lower than the closing price of the bearish one.
So without further explanation, let’s see an example of the piercing line pattern on a candlestick chart:
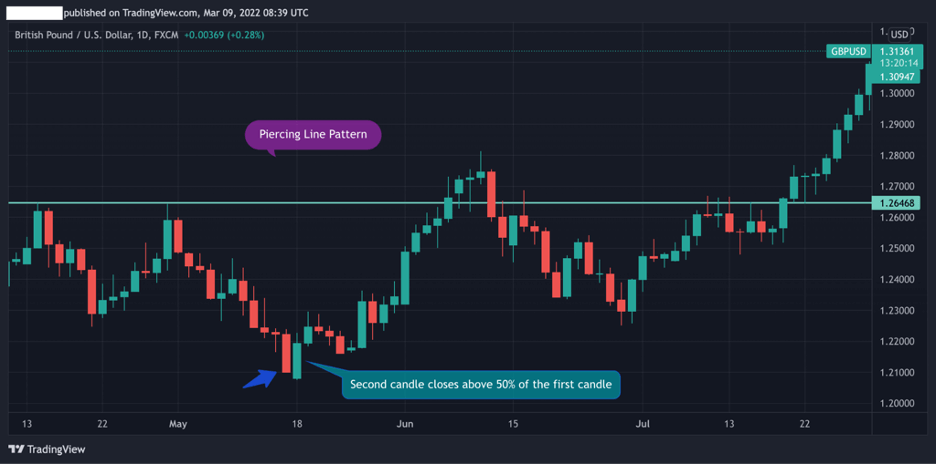
As you can see in the GBP/USD daily chart, the piercing line two candlestick formation occurs at the bottom of a mini downtrend. The second bullish opens below the first bearish candle creating a minor ‘gap’, and the closing price is greater than the 50% level of the first candlestick.
Taking the above mentioned into account, here are the steps you need to follow to use and trade the piercing line chart pattern:
- Find a two candle pattern with a first bearish candle and a second bullish candle that opens below the first candle’s closing price and closes above the 50% level of the first bullish candle
- Add additional technical analysis indicators to confirm the reversal – Moving Averages, RSI, MACD, and Fibonacci levels
- Enter a buying trade after the third candle (or one of the following candles) is completed and if the price closed above the second candle’s closing price
- Set a stop-loss order at or below the lowest level of the second bullish candle and a take profit target at the top of the prior trend
How to Trade the Piercing Line Pattern (Trading Strategies)
Like many other trend reversal indicators, the piercing line is a lagging indicator and, therefore, should not be traded in isolation. And, because chart candlestick patterns tend to repeat themselves time after time, using the appropriate technical indicators could help you increase the chances of success.
To help you with that, below we will show you two basic trading strategies to use when identifying the piercing line two-candlestick pattern.
1. Trend Reversal Indicators
Since the piercing line is a trend reversal pattern, you would want to do whatever possible to confirm that the reversal is about to occur. In that sense, the most effective way to do so is to use trend reversal technical analysis indicators such as RSI, Stochastic, and MACD.
So, if you have identified the piercing line pattern as we explained above, you need to simply add these indicators to your trading chart and see if they are correlated with the pattern price movement.
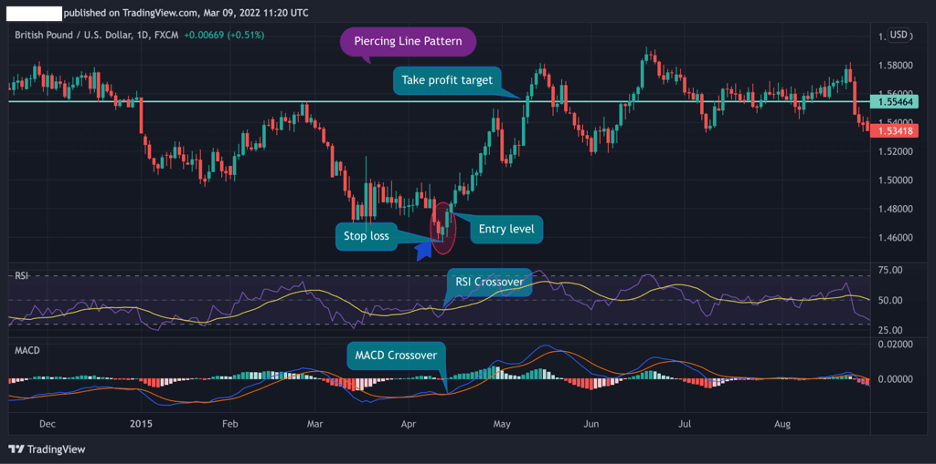
In the GBP/USD daily chart below, both the RSI and MACD confirm the reversal. Still, you should only enter a trade once the candle following the second candle is completed and closes above the previous bullish candle.
Take profit should be placed at the highest level of the last trend as the markets tend to move in repetitive waves.
Stop loss is located below the lowest level of the second bullish candle (if the price breaks this level, the pattern is invalidated, and you switch sides and enter a short-selling position).
2. Fibonacci Retracement Levels
Using trend reversal indicators is undoubtedly an excellent method to confirm a reversal, but if you want to use another popular tool, Fibonacci retracement levels are the answer.
The reason why I like the Fibonacci tool is that I know I’m not the only one who is using it. That’s the magic of Fibonacci retracement levels – many traders worldwide watch these levels, and if you join them – well, you can take advantage of using Fibonacci support and resistance levels. And that is why it is so essential to learn how to use the Fibonacci Retracement tool.
Furthermore, another benefit of using Fibonacci retracements is that you can expand the chart and look at a wider time frame. Using the same example as before, the chart below shows us how Fibonacci retracement levels can help you find entry and exit points.

As you can see, there are so many options. First, we drew Fibonacci retracements from the highest level to the lowest of the previous trend, which is also the lowest level of the second bullish candle in the piercing line candle formation. In such a scenario, the stop loss is placed below the lowest level of the second bullish candle.
For setting entry points – you can enter a position immediately after the next candle is completed and closes above the closing price of the second candle. Or, you can play safe – meaning enter a position at the 23.6% Fib level. Take profit could be located at 23.6% (if joining after the third candlestick), or at the 38.2%, 50% Fibonacci levels.
The Piercing Line Pattern – Pros and Cons
These are the most common pros and cons of trading the piercing line chart pattern:
Pros
- Simple to use
- Reliable chart pattern on short and long term time frames (daily, weekly, monthly)
- One of the most frequently occurring patterns in technical analysis
Cons
- The piercing line pattern cannot be traded in isolation – other technical indicators are essential to confirm the pattern
Frequently Asked Questions (FAQs)
Here are some of the most frequently asked questions about the piercing line pattern in trading:
What does the piercing pattern line indicate?
Simply put, the piercing pattern is a two-candle formation (much like the separating line candlestick pattern), that signals a potential reversal zone after a downtrend and offers traders to enter a buying opportunity. In essence, traders use this classical chart pattern to identify the change in the trend and find entry and exit levels.
What is a bearish piercing line pattern?
Even though the piercing line pattern is seen as a bullish reversal pattern, the same formation could be formed on the other side, meaning at the top of an uptrend. In this case, you’ll see a long bullish candle followed by a long bearish candle that closes below 50% of the body of the previous bullish candle.
What is the difference between the piercing line candlestick pattern and the bullish engulfing pattern?
Both the bullish engulfing and the piercing line are bullish trend reversal patterns with similar appearance and formation. The only difference is the two candle formations – while the engulfing pattern is characterized by a first bearish candle and a larger second bullish candle, the piercing pattern has a first long bearish candle and a shorter second bullish candle.
Risk Disclosure: The information provided in this article is not intended to give financial advice, recommend investments, guarantee profits, or shield you from losses. Our content is only for informational purposes and to help you understand the risks and complexity of these markets by providing objective analysis. Before trading, carefully consider your experience, financial goals, and risk tolerance. Trading involves significant potential for financial loss and isn't suitable for everyone.


