The rounding bottom is a bullish trend reversal chart pattern that signals the end of a downward trend and the beginning of a new upward trend.
But how do you find and trade the rounded bottom chart pattern? And what are the trading strategies you need to know about when using this pattern? All the answers are below.
What is the Rounding Bottom Pattern?
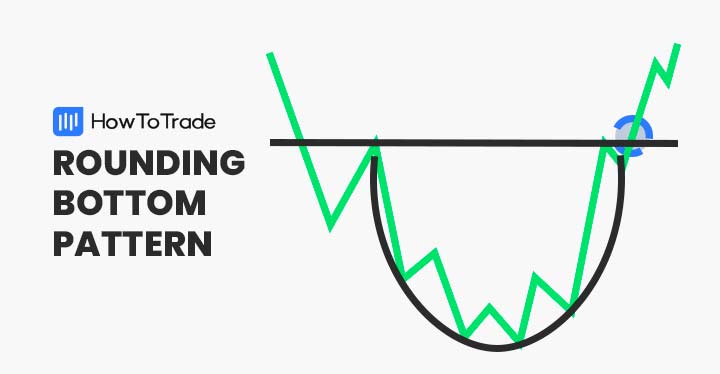
The rounding bottom chart pattern, also known as the saucer bottom pattern, is a trend reversal pattern used in technical analysis to identify the end of a downward trend and the gradual price shift from a bearish to a bullish trend. It is the opposite version of the rounding top bearish pattern and has the shape of the letter U.
The rounding bottom pattern consists of a rounded bottom U formation and a neckline resistance level in terms of structure. The U formation is characterized by bearish and bullish sides from the initial declining slope to the second part of the actual pattern which is in a bullish direction.
Once the breakout above the resistance horizontal line occurs, the pattern is completed, and a new uptrend is likely to begin.
How to Identify the Rounding Bottom Pattern in Trading?
Since the rounding bottom pattern is a bullish reversal chart pattern, you’ll have to find this pattern at the end of a bearish trend. As soon as the U shape is formed and you can draw a clear resistance neckline, you can assume that this is the rounding bottom candlestick.
Moreover, another helpful tool is to add a trading volume indicator and see if there’s an increasing demand for the asset (based on the Wyckoff accumulation theory).
Usually, when the pattern forms, you’ll see high volume as many traders sell their short positions and many others buy the asset at a lower price. As the price consolidates and the selling pressure eases, you can expect flat volumes in the currency pair or stock price.
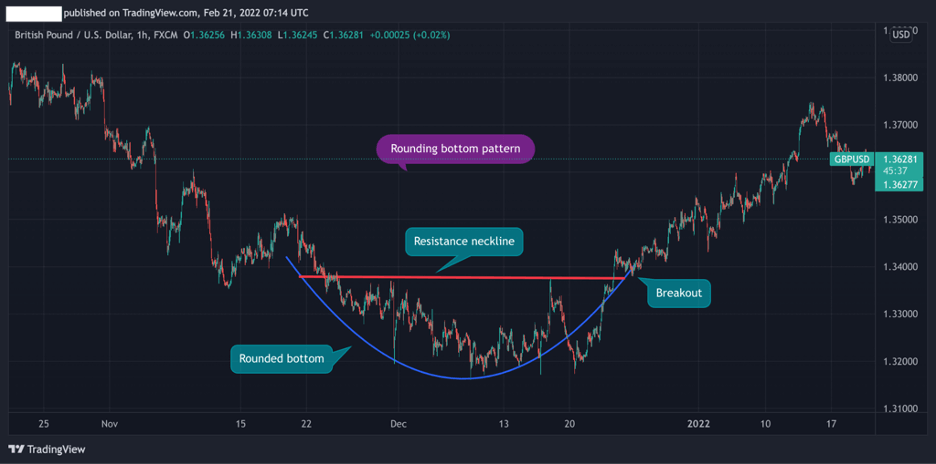
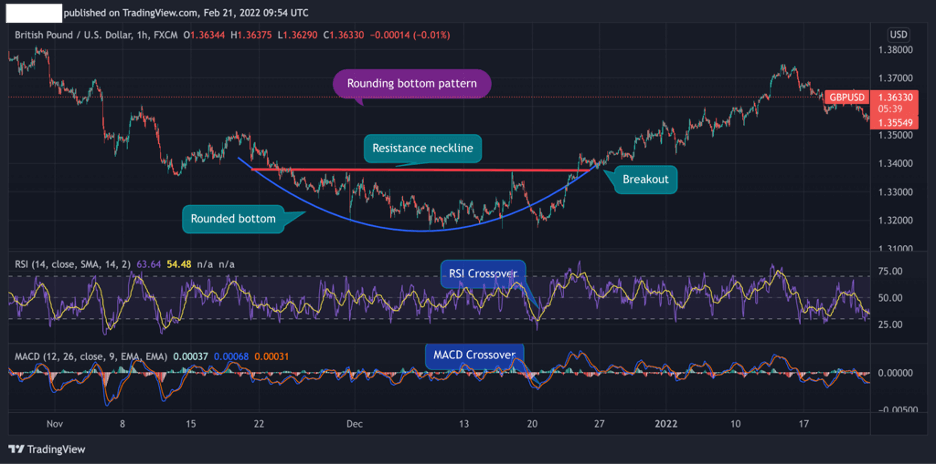
In the EUR/USD 1H price chart below, we can see an example of a rounding bottom formation. The U shape appears after a selling rally, and the price fails to break the resistance neckline twice. Eventually, the rounding bottom pattern is confirmed when the pattern breaks above the neckline and generates a bullish signal.
Taking the above into account, here are the steps you need to follow to effectively use the rounding bottom candle pattern:
- Identify price consolidation in the U shape following a temporary downward trend
- Find a resistance neckline with at least two failed attempts to break above the line
- Add another technical analysis tool to confirm the trend reversal – Fibonacci retracements, RSI, and MACD
- Enter a long position when the breakout occurs. It’s advisable to wait for the first candle following the breakout to close above the neckline
- Set a stop-loss order at the lowest level of the rounding bottom formation
How to Trade the Rounding Bottom Pattern (Trading Examples)
Trading the rounding bottom pattern works the same way as other trend reversal patterns and bottom chart patterns. Much like the double bottom pattern and the triple bottom pattern, you’ll be looking to enter a long position when the price trades above the neckline and changes direction.
Still, it is recommended to not use the pattern on its own. Instead, you better combine it with other trading strategies and technical indicators. Below, we will show you how to use the rounding bottom pattern with momentum indicators and Fibonacci support and resistance levels.
1. Add Momentum Indicators – MACD and RSI
As mentioned above, the rounding bottom pattern is a trend reversal candlestick pattern. It means you need to verify the price reversal by using trend reversal technical analysis indicators.
Two of the most important indicators to confirm price reversals are the Relative Strength Index (RSI) and the Moving Average Convergence Divergence (MACD).
For that reason, you need to add these two indicators to your trading chart. Using the same chart above, we’ve added the RSI, and the MACD to confirm the trend reversal. As you can see, both indicators have made the crossover even before the price breaks above the resistance neckline.
When this happens, you can be sure that the control is in the hands of buyers. You can wait for one of the candles following the breakout to close above the resistance neckline for another confirmation.
2. Fibonacci Retracement Levels
The second trading strategy you can use when trading the rounding bottom pattern is to apply Fibonacci retracement levels.
This is vital in all technical analysis chart patterns and works effectively with all technical indicators. We mention the use of Fibonacci ratios in most of our articles as it is one of the most valuable indicators to use.
To use Fibonacci retracement levels, you need to draw the Fib lines from the highest level of the prior trend to the lowest point within the rounding bottom area.
The chart below shows that the rounding pattern starts and ends at the 38.2% Fibonacci level. In this case, that would be the ideal entry-level position for a long position with a take profit at the 61.8% level. A stop-loss order is placed at the 23.6% level or the 0% level.
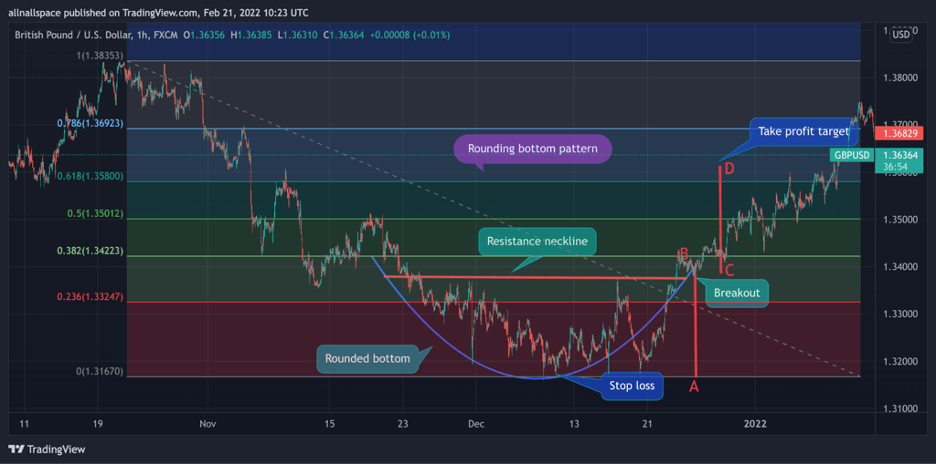
Additionally, as you can see in the chart above, we used the measurement technique to evaluate the length of the next price movement following the breakout. According to this method, the upside movement should be at least the same size as the rounded pattern (AB=CD).
The Rounding Bottom Pattern – Pros and Cons
These are the most common pros and cons of trading the rounding bottom chart pattern:
Pros
- An accurate chart pattern
- Stop loss and take profit target is well defined
- Works well when used in combination with momentum indicators and Fibonacci ratios
Cons
- Difficult to spot and identify
- Used primarily by long term investors – Less suited for short term traders as it is a long term reversal pattern
Key Takeaways
To sum up, here are the most important things to remember about rounding bottoms:
- A rounding bottom is a bullish trend reversal pattern that occurs at the end of a downward trend and signals the transition from a downtrend to an uptrend
- The pattern has a shape of the letter U with a resistance neckline at the top of the pattern
- To trade the rounding bottom pattern, a buy entry should be placed once the price breaks above the neckline
- A stop-loss order is located at the bottom of the rounding bottom area. Profit targets are set at the level of around the same length of the rounding bottom area (see last example chart)
Risk Disclosure: The information provided in this article is not intended to give financial advice, recommend investments, guarantee profits, or shield you from losses. Our content is only for informational purposes and to help you understand the risks and complexity of these markets by providing objective analysis. Before trading, carefully consider your experience, financial goals, and risk tolerance. Trading involves significant potential for financial loss and isn't suitable for everyone.