The bullish abandoned baby is a three-candle formation used by traders to identify the end of a downtrend and may indicate that the market is about to reverse. This bullish reversal pattern is relatively easy to recognize and use as it combines the construction of Doji candlestick and gap trading.
This article will show you how to use and trade the abandoned baby bullish candle pattern. Keep reading to learn more.
What is the Abandoned Baby Bullish Candlestick Pattern?
The abandoned baby bullish is a chart pattern that appears at the end of a downward trend and signals the transition from a bearish to a bullish price movement.
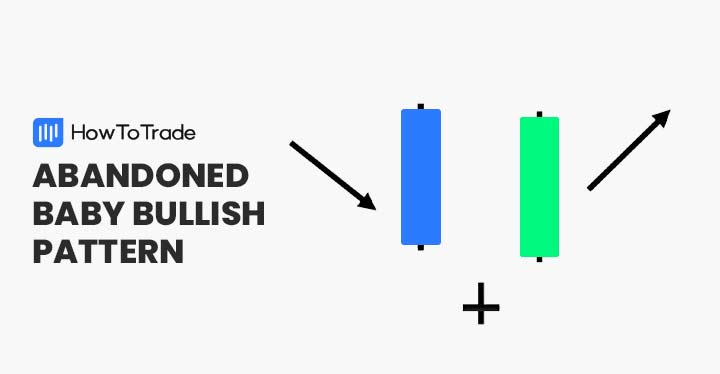
The pattern is made of three consecutive candles – the first is a solid bearish candle with a long body, the middle is a Doji candle pattern gapping below the first candle, and the third tall bullish candle gapping above the second.
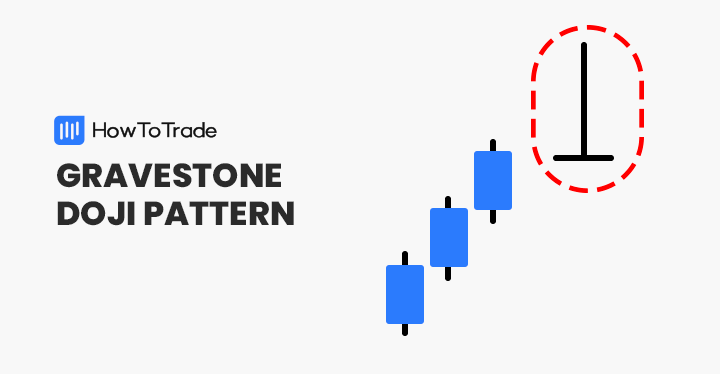
In the opposite direction, the same pattern – the bearish abandoned baby pattern, also known as the abandoned baby top – signals that the market is transitioning from an uptrend to a downtrend.
In its appearance and outcome, the abandoned baby bullish pattern is similar to the shooting star pattern, the evening star pattern, and even the breakaway pattern. Yet, there’s one difference: the gapping of the middle Doji candlestick makes this pattern more reliable and unique. For that reason, the pattern received its name due to the abandonment of the Doji candlestick.
How to Identify the Abandoned Baby Bullish Pattern in Trading?
To identify the abandoned baby bullish pattern, you will have to get familiar with its fundamental characteristics:
- It appears at the bottom of a downtrend.
- It consists of three candles, one after the other, with the first being a long bearish candle, the second being a Doji bearish or neutral candle, and the last being a long bullish candle.
- And most importantly, the Doji middle candle is gapping below the first candle and above the third one.
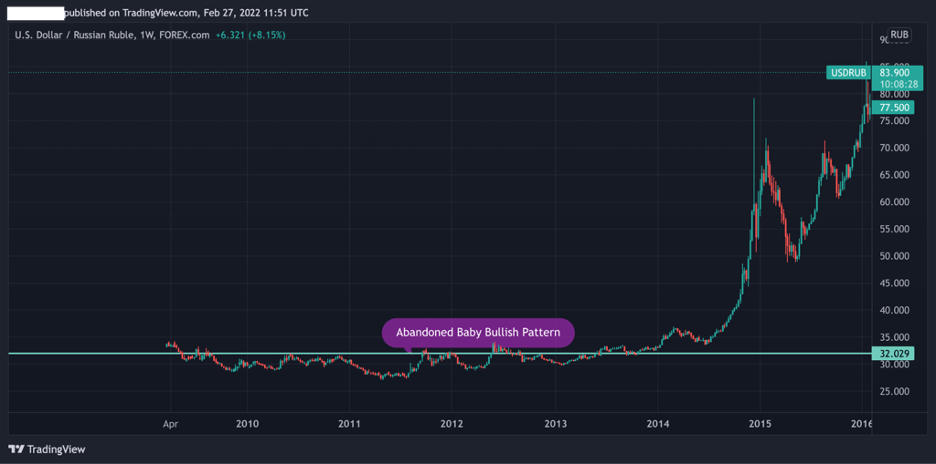
Before we continue, let’s see what the abandoned baby bullish candle pattern looks like on a price chart.

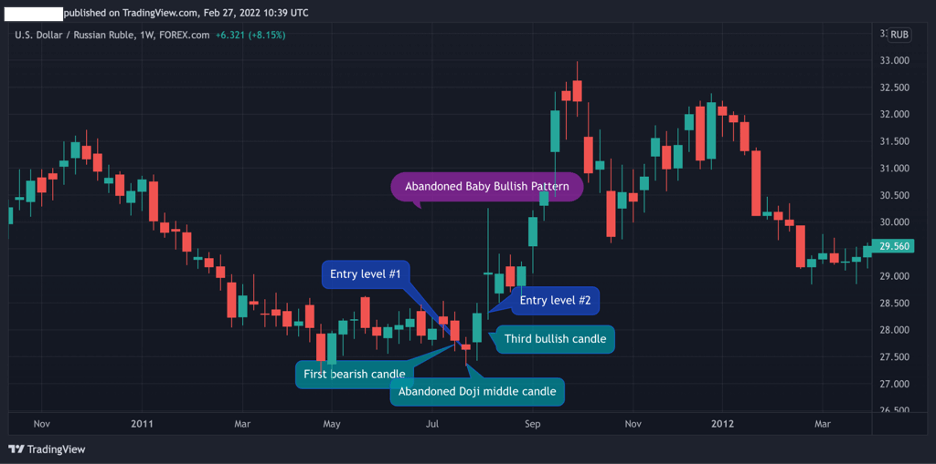
The USD/RUB weekly chart shows us a perfect example of the abandoned baby bullish pattern. Following a downward trend, the three-candle formation appears with a first bearish candle, a middle bearish Doji candle, and a third bullish candle.
In this case, a trader will enter a position once the third candle is fully completed or as soon as the second candle gaps below the first candle.
Now that you know how to identify the pattern, you must follow some basic rules to trade the abandoned baby bullish pattern.
- Identify a three-candlestick formation following a downward trend – first bearish candle, second Doji candle with the same opening and closing prices that gaps below the first, and above the third bullish candle
- Add Fibonacci retracement levels and trend reversal momentum indicators
- Enter a long position when the third candle is completed, or when the second candle opens at a gap below the first one
- Set a stop-loss order below the Doji candle and set the take profit target at the highest level of the prior bearish trend
How to Trade the Abandoned Baby Bullish Candlestick (Trading Strategies)
Trading the abandoned baby bullish patterns is quite simple. It is the ideal charting pattern for experienced traders as it certainly provides a strong indicator for a bullish trend reversal.
However, whenever you identify the abandoned baby bullish pattern, you need to find trading strategies that will help you confirm the reversal and find the right entry-level, stop loss, and take profit target.
Below, we show you two trading techniques to trade the abandoned baby bullish pattern:
1. Abandoned Baby Bullish Pattern and Gap Trading
For experienced traders, gap trading is a valuable and easy trading strategy. Simply put, a gap is an area in a chart where the price either rises or falls from the previous period’s closing price with no trading activity in between. Traders usually jump on the opportunity when this happens, as these gaps tend to be filled over time.
This is the good thing with the abandoned baby bullish pattern. As we have seen in the previous section, the Doji candle gaps between the first and second candles and between the second and the third. But how exactly do you trade gaps?
Well, there are several different ways to trade gaps. The first way is more suited for aggressive short-term technical analysts and traders. In this way, you’ll buy the asset immediately when you identify a price gap without any confirmation tool, as these gaps usually tend to get filled (in the chart, entry-level #1).
The second technique suits conservative traders who want to confirm the reversal before entering a position. In such a situation, you’ll wait for the third candle to get completed and only then enter a buy position (in the chart, entry-level #2).
2. Use the Fibonacci Level and Momentum Indicators
Since the abandoned baby bullish is a trend reversal pattern, you better confirm the reversal with other tools.
First and foremost, Fibonacci retracement levels are an excellent technical analysis tool to ensure the price reverse and identify stop loss and take profit location.
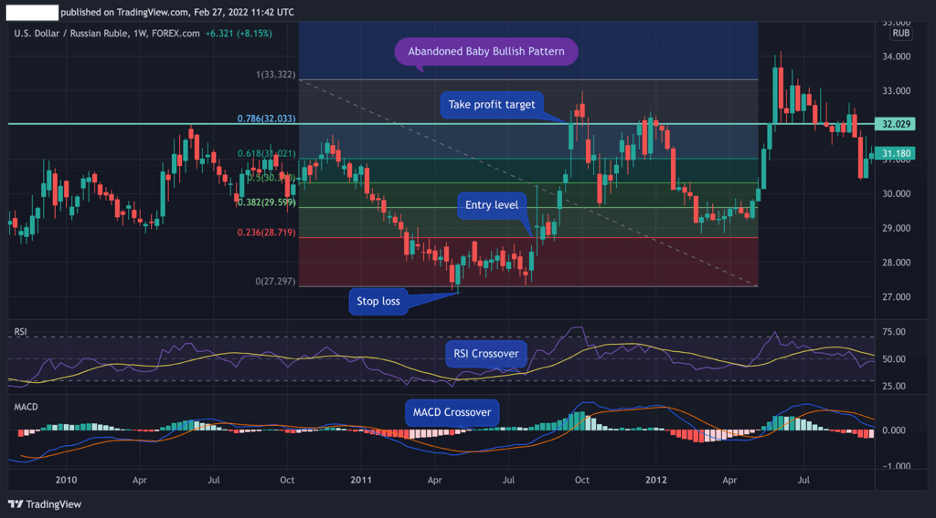
In the above USD/RUB weekly chart, we drew Fibonacci levels from the highest level of the previous trend to the lowest level (which is, in this case, also the Doji candle). In addition, we also added the two trend reversal indicators – the Relative Strength Index (RSI) and the Moving Average Convergence Divergence (MACD).
As you can see, the perfect market entry level is at the 23.6% Fibonacci level that comes following the third candle confirmation, the RSI crossover, and the MACD crossover. The take profit is located at the 78.6% Fib level, which is also the highest level from the previous price swing.
BTW, as you can see in the chart below, in our example, the abandoned baby bullish pattern was pretty good over the long term:)
The Abandoned Baby Bullish Pattern – Pros and Cons
These are the most common pros and cons of trading the abandoned baby bullish pattern:
Pros
- Easy to identify
- It provides a powerful signal for a trend reversal
- A great trading strategy for scalpers and long term traders as they can take advantage of gap trading and a Doji candlestick formatio
Cons
- The abandoned baby bullish is a rare pattern
- Without the use of Fibonacci retracement levels, stop loss is not well defined
Key Takeaways
Here are the key takeaways to remember about the abandoned baby bullish candlestick patterns.
- The bullish abandoned baby pattern is a trend reversal formation used by the traders to enter a long buying position
- The pattern is made of three candles – a long bearish candle followed by a Doji candle gapping the first and a third bullish positive candle gapping above the second candle
- Due to its rarity and unique formation, the abandoned baby bullish pattern is one of the most powerful trading patterns that signal a strong buying opportunity
- To confirm the trend reversal, it is best to use Fibonacci levels and trend reversal indicators
- Stop-loss should be placed below the Doji candle and take profit at the highest level of the previous trend (or at one of the following Fibonacci levels)
Frequently Asked Questions about the Abandoned Baby Bullish Pattern
Below are some of the most frequently asked questions about the abandoned baby bullish pattern:
What is the difference between the bullish abandoned baby pattern and the morning star candle pattern?
The abandoned baby bullish pattern and the morning star chart pattern are similar in appearance and meaning. They both are trend reversal bullish classical chart patterns with three candle formations. However, the difference between the two patterns is that the Doji candle in the abandoned baby bullish pattern is gapping below the first candle above the third candle. On the other hand, the morning star chart pattern has no gapping of any one of the candles.
What does the abandoned baby bullish chart pattern tell us?
Simply put, the abandoned baby bullish chart pattern indicates that the prior trend is close to ending, and a new uptrend is about to start. In other words, it is a trend reversal chart pattern used by traders to enter long positions.
What time frame is best for the bullish abandoned baby candlestick pattern?
Since the abandoned baby bullish pattern is considered a long-term chart pattern, it can usually be found on long-term rather than short-term time frames. Therefore, in our view, the best time frames to identify and use this pattern include 1 hour, 4 hours, daily, weekly, and monthly candlestick charts.
Risk Disclosure: The information provided in this article is not intended to give financial advice, recommend investments, guarantee profits, or shield you from losses. Our content is only for informational purposes and to help you understand the risks and complexity of these markets by providing objective analysis. Before trading, carefully consider your experience, financial goals, and risk tolerance. Trading involves significant potential for financial loss and isn't suitable for everyone.