Are you familiar with the parabolic curve pattern? If not, be sure to check out the article below. We’ll teach you how to recognize, interpret, and trade this powerful chart pattern.
What is the Parabolic Candlestick Pattern?
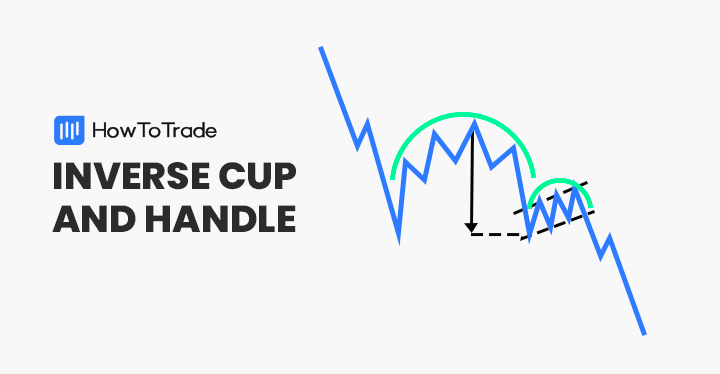
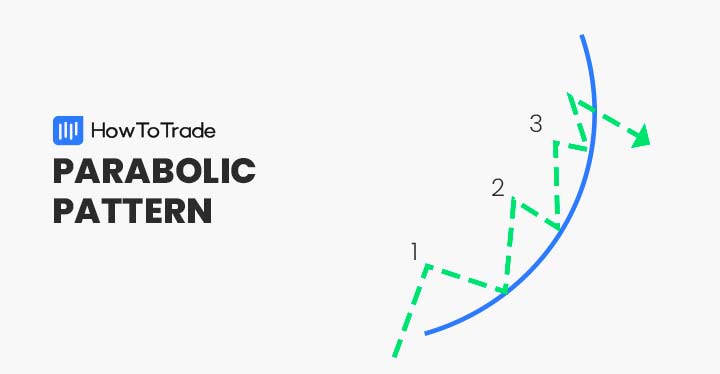
Parabolic arc chart patterns are classical formations that signal the possible reversal of a bullish trend. The pattern is named after the “parabola” geometric shape, a curved line with an upward trajectory.
Traders view the parabolic formation as one of the strongest uptrend patterns that precede reversal. Accordingly, it is used to sell and open new short positions in FX currency pairs.
How to Identify the Parabolic Pattern in Trading?
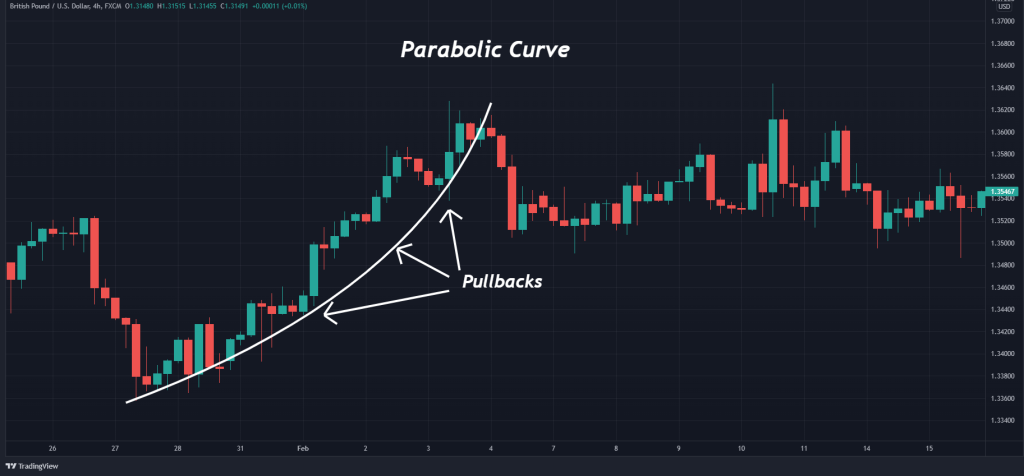
Parabolic curve patterns are commonly found in all FX pairs and in all time frames. Visually, the formation appears as an upward-curved trend line and has a parabolic curve step-like formation.
The GBP/USD chart below gives us a comprehensive view of this price action pattern.
Here are the guidelines for recognizing and trading parabolic arc patterns:
- Identify a prevailing bullish trend.
- Locate a series of measured pullbacks.
- Draw a curving trend line beneath the pullback lows.
- Upon price retracing beneath the trend line, a short entry is established.
Recognition
Most parabolic arc patterns are relatively simple to spot in real-time. Each formation consists of an uptrend in price and a series of consolidation and pullback periods.
Constructing the parabolic arc is routine. All one needs to do is draw a curving line with an upward trajectory beneath the pullbacks. It is a strong price pattern sought after by forex technicians and traders worldwide.
Bullish Or Bearish
Although the parabolic curve pattern occurs during strong bullish trends, it is a bearish indicator. Why? The upward trajectory of the curved line suggests that buyers are in complete control of the market. However, the buying pressure becomes exhausted as time passes, and a reversal is possible.
Generally, parabolic arc patterns return or retrace toward pre-trend levels. In this way, the bullish price action is interpreted as a precursor for bearish market behavior.
Standalone Indicator
The parabolic curve pattern is a standalone indicator. Although it may be used in concert with other technicals, the formation functions well in an isolated capacity. Fibonacci retracements are often used to determine profit targets upon a short position being opened. Within the trade management context, this type of indicator is valid.
Feel free to check this video on how to master the Parabolic Curve pattern and trade it on any market:
How to Trade the Parabolic Candlestick Pattern (in 3 Easy Steps)
As with any chart pattern, there is a process to trading the parabolic curve. It consists of locating market entry, stop-loss orders, and profit targets. If you stick with the process, a very predictable outcome, win or lose, is ensured.
In the section below, we will show you the process of parabolic curve trading.
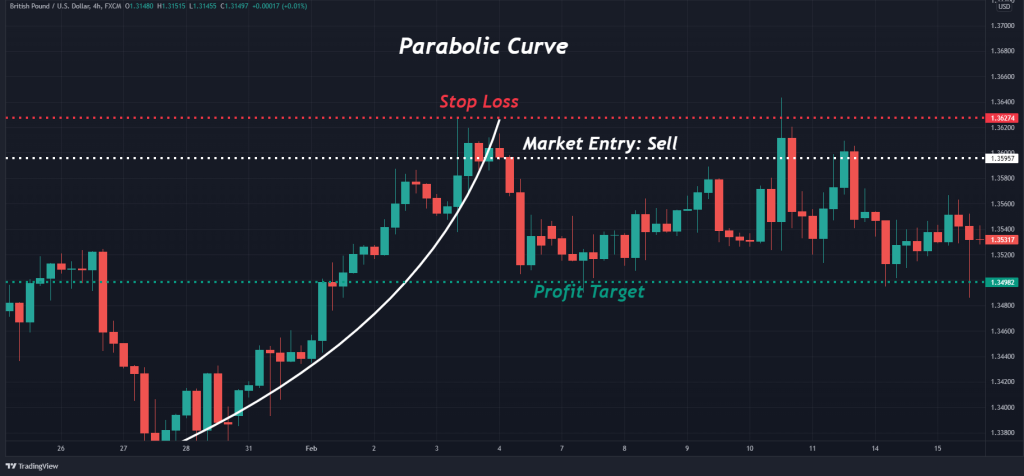
1. Market Entry
At its core, parabolic arc patterns suggest a pending bearish reversal. Thus, the formation provides a signal to sell a currency pair, CFD, or stock.
A sell order is entered to short the market using the parabolic curve when the channel trend line connecting pullbacks is violated. At this point, a new short position is opened.
2. Stop Loss
Locating a stop-loss using the parabolic arc is straightforward. All you need to do is place a buy-stop order above the upper extreme of the pattern.
One places a stop-loss above the upper trend line mark to do so. If the bullish trend continues and does not reverse, this order protects the account from an extraordinary drawdown.
3. Profit Targets
Parabolic curve patterns furnish sell signals to active traders. Therefore, profit targets are placed beneath market entry at the curved trend line.
There are many ways to set profit targets using the parabolic arc. Standard risk vs. reward ratios, trailing stops, or additional technical indicators may be applied. One of the most common is Fibonacci retracements, specifically the 38% and 62% levels.
Example of How To Trade Parabolic Arc Chart Patterns
Trading the parabolic curve chart pattern is routine. The GBP/USD price chart below gives us a good look at the process top-to-bottom.
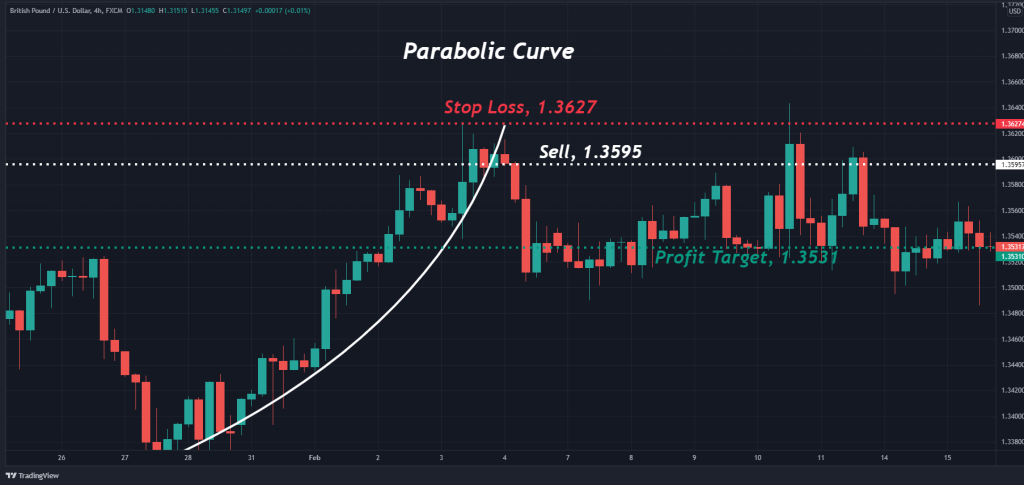
Here is how the trade above was executed:
- A bullish trend was identified.
- The parabolic curve was constructed. This was done by connecting the periodic range pattern multiple times with an upward trajectory.
- A sell order is placed beneath the curving trend line (1.3595).
- A stop-loss order is located above the pattern’s upper extreme (1.3627).
- A profit target is placed beneath the pattern at a 1:2 risk vs reward (1.3531).
- Upon the profit being hit, a 64-pip gain was realized.
The Parabolic Pattern – Pros and Cons
These are the most common pros and cons of trading the parabolic chart pattern:
Pros
- Occurs on all timeframes in FX pairs, CFDs, and stocks
- TRelatively easy to locate market entry, stop losses, and profit targets
- May produce significant profits on more extensive timeframe charts
Cons
- Loses efficacy in rotating markets
- Strong bullish trends can produce false signals
- Determining bearish market follow-through towards profit targets can be challenging
Key Takeaways
In conclusion, here are the key takeaways:
- The parabolic curve pattern develops during strong bullish trends. It is a bearish reversal indicator that is fueled by the exhaustion of buyers
- One connects the lows created by a series of market pullbacks to construct the formation. As a result, the pattern visually depicts an upward sloping curve
- One enters a sell order beneath the lower channel line when trading parabolic curves. A stop loss is placed above the upper extreme of the formation while profit targets are beneath the curved line
Frequently Asked Questions (FAQs)
A few of the most frequently asked questions regarding the parabolic curve pattern are the following.
How much money do I need to trade parabolic curves?
Any account size is sufficient! All you need to do is adjust your position size and risk to reflect your available capital.
Is the parabolic curve a dependable reversal pattern?
Yes. You can certainly rely on the parabolic curve indicator to make trading decisions. However, no chart formation is 100% accurate. Be sure to implement proper risk management parameters when trading the parabolic curve.
Can I combine parabolic curve patterns with additional technical indicators?
Yes. Although the parabolic curve functions well by itself, other indicators may be added to the analysis at your discretion. When spotting the parabolic curve pattern, you should combine other technical indicators such as the Relative Strength Index, MACD, Stochastic, and moving averages. For more information about any of these indicators, you can visit our cheat sheets library page.
Risk Disclosure: The information provided in this article is not intended to give financial advice, recommend investments, guarantee profits, or shield you from losses. Our content is only for informational purposes and to help you understand the risks and complexity of these markets by providing objective analysis. Before trading, carefully consider your experience, financial goals, and risk tolerance. Trading involves significant potential for financial loss and isn't suitable for everyone.