A triple bottom is a bullish reversal chart pattern found at the end of a bearish trend and signals a shift in momentum.
Much like its twin, the triple top pattern, it is considered one of the most reliable and accurate chart patterns and is fairly easy to identify on trading charts.
But what does a triple bottom pattern look like? And how do you use it in your trading? Keep reading to learn more.
What is the Triple Bottom Pattern?
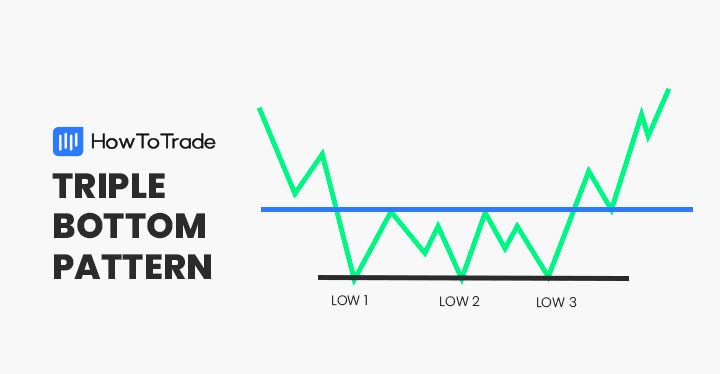
The triple bottom pattern is a bullish reversal chart pattern that is formed after a downward trend and is composed of three consecutive bottoms and a resistance neckline. Following the breakout, there’s often a trend reversal and a bullish trend begin.
In terms of the structure, the triple bottom pattern consists of three failed attempts to break the support line at the same price level and then a breakout above the resistance neckline. When this happens, the breakout point indicates a bullish trend direction where a long position is taken.
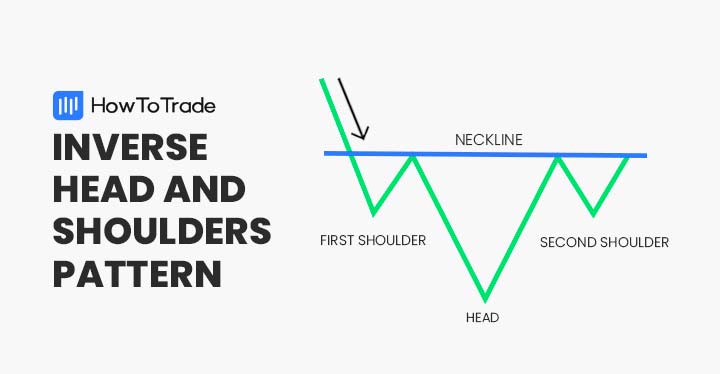
Generally, this technical analysis pattern has a similar pattern shape to other reversal patterns such as the double bottom pattern and the head and shoulders pattern. Obviously, it also works the same as the triple top pattern, which moves in the other direction and is, therefore, a bearish reversal chart pattern.
How to Identify and Use the Triple Bottom Pattern?
A triple bottom formation occurs when the price of a currency pair cannot break below a certain resistance level and bounces back three consecutive times. Due to its clear pattern – it’s fairly easy to identify the triple bottom pattern.
Simply put, the pattern comes at the end of a downward trend and has three bottoms at the same level. The confirmation of the pattern occurs when the price breaks above the neckline, which serves as a resistance level. When this happens, sellers lose control and buyers take over.
Taking a look at the EUR/JPY 30-min chart below, we can see how the triple bottom pattern is formed in reality.
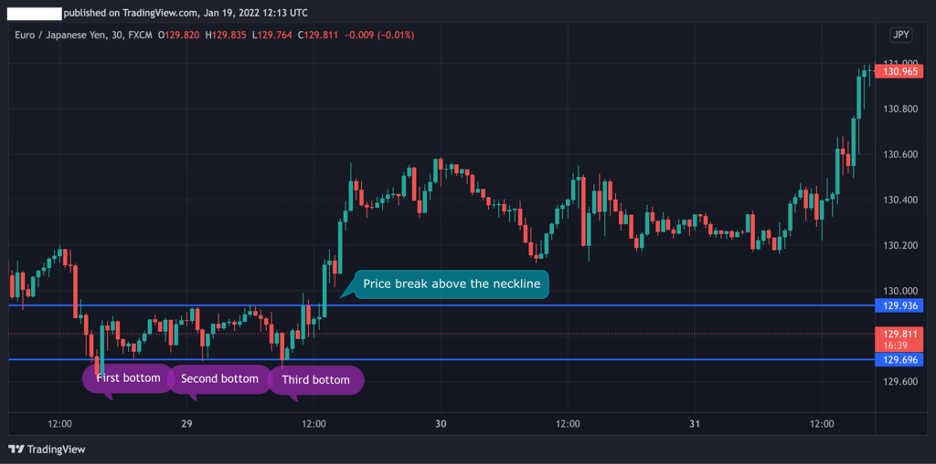
Following the downtrend, the price of the EUR/JPY gets into consolidation mode with three attempts to break the support line. Once the price bounces back and breaks above the neckline, a bullish trend is confirmed and the pair continues to trade higher.
Taking the above into account, here are the steps you need to take in order to apply the triple bottom pattern trading strategy:
- Identify triple bottoms at a support line that appear after a bearish clear downtrend
- Draw a resistance line around the highs of all price swings
- Wait until the price breaks above the resistance neckline
- Draw Fibonacci retracement levels or add the MACD indicator
- Enter a long buying position with a stop-loss order at or slightly below the neckline
How to Trade the Triple Bottom Pattern?
As mentioned, the triple bottom pattern is a bullish trend reversal indicator. This means, there is no confusion as to how to trade this pattern and essentially, a trader will be looking for the right entry point to buy the asset. This is done when the breakout occurs and the asset breaks above the neckline.
To effectively use this chart pattern, it is also important to combine other technical indicators in order to confirm the reversal and to help you find the best price where you should place a stop-loss order.
With that in mind, we are going to show two useful technical indicators to combine with triple bottom patterns – the MACD (Moving Average Convergence Divergence) and Fibonacci retracement levels.
Moving Average Convergence Divergence (MACD) and Triple Bottom Chart Patterns
The MACD is a popular momentum indicator used to spot trend reversals. Basically, when you add the MACD indicator to a price chart with a triple bottom pattern, you’ll be looking for a crossover at the exact level where the price breaks the resistance neckline.
Using the same chart from the above example, we inserted the MACD to get another signal for a trend reversal. As you can see, the MACD crossover occurs when the price reaches the resistance line and therefore, helps us confirm the trend reversal.

Fibonacci Retracement Levels and Triple Bottom Chart Patterns
Well, personally, Fibonacci retracement levels are among my favorite technical indicators no matter what pattern you decide to use. Why? Because Fibonacci retracement levels are so popular and often used by many traders. Therefore, these Fibonacci price levels become key support and resistance areas.
Let’s take an example to see how the integration of Fibonacci retracement levels works with the triple bottom pattern.
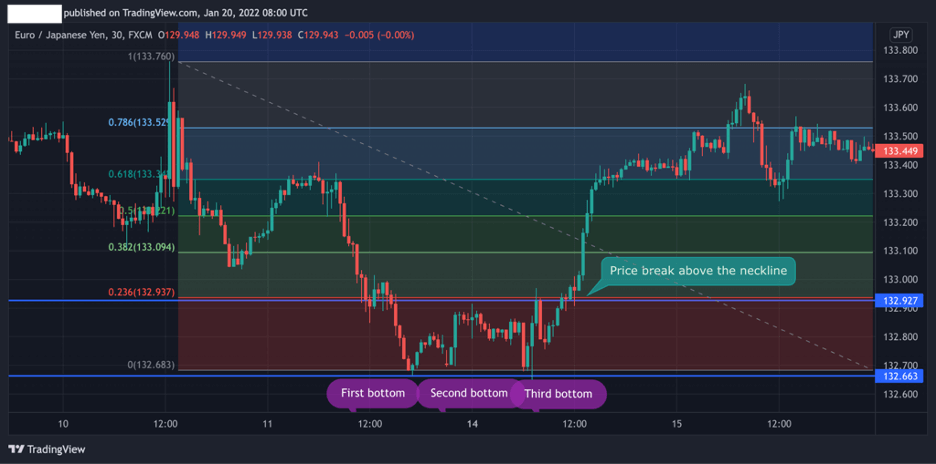
As you can see in the EUR/JPY 30-min chart above, the price bounces back following three failed attempts to break the resistance line. The beauty here is that the break occurs at the exact 23.6% Fibonacci level, which indeed confirms the breakout.
In this case, everything is easier – stop loss could be placed at the 0% Fibonacci level, and take profit could be placed at the 50% level or even higher.
The Triple Bottom Pattern – Pros and Cons
These are the most common pros and cons of trading the tripe bottom pattern:
Pros
- Simple and easy to identify on trading charts
- It is a reliable chart pattern and a strong trend reversal indicator
- Potential for high rewards
- Very effective trading strategy if used in combination with other technical analysis indicators such as the MACD and Fibonacci retracement levels
Cons
- Not a frequently occurring pattern
- Needs integration with other technical analysis tools in order to confirm the reversal
Everything About the Triple Botton Pattern in One Video
Watch this video to learn how to identify and trade the triple bottom pattern with real-time examples.
Key takeaways
To sum up, here are the key takeaways:
- The triple bottom pattern is a bullish reversal pattern that appears at the end of a downtrend
- The chart pattern is characterized by three bottoms followed by a price breakout above the neckline level
- When using the triple bottom pattern – Traders will be looking to enter a long trade once the price rises the neckline. Stop-loss should be placed slightly below the neckline or at the nearest Fibonacci level
- To develop an effective triple bottom pattern trading strategy, it is important to combine other tools like the MACD indicator and Fibonacci ratios
Risk Disclosure: The information provided in this article is not intended to give financial advice, recommend investments, guarantee profits, or shield you from losses. Our content is only for informational purposes and to help you understand the risks and complexity of these markets by providing objective analysis. Before trading, carefully consider your experience, financial goals, and risk tolerance. Trading involves significant potential for financial loss and isn't suitable for everyone.