


The symmetrical triangle is a technical analysis chart pattern that represents price consolidation and signals the continuation of the previous trend. It is one of the most common triangle chart patterns and is widely used by technical traders to identify entry and exit points.
Here, in this article, we are going to explain everything you need to know about the symmetrical triangle chart pattern.
- What is the symmetrical triangle candlestick pattern?
- The symmetrical triangle candlestick pattern (VIDEO)
- How to identify and use the symmetrical triangle candlestick pattern?
- How to trade the symmetrical triangle candlestick pattern?
- The symmetrical triangle candlestick pattern – Pros and cons
- Key takeaways
What is the Symmetrical Triangle Candlestick Pattern?
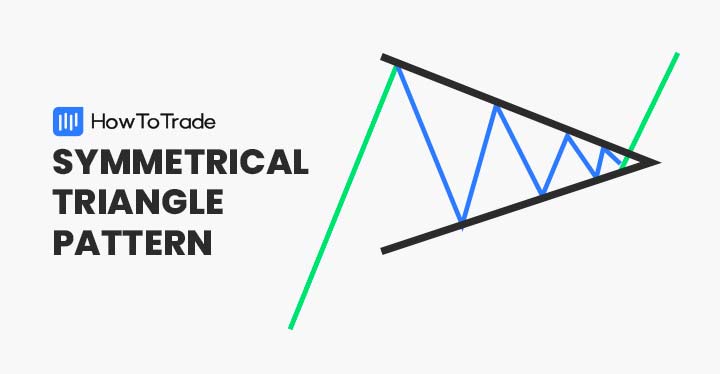
A symmetrical triangle is a common chart pattern that appears during an ongoing trend and indicates that the prices are consolidating before moving higher or lower. The pattern is characterized by two converging trendlines, creating a shape of a triangle.
It has quite a similar formation as the ascending triangle pattern and the descending triangle pattern, however, the symmetrical triangle does not have a horizontal lower or upper trend line. Instead, it has an upper descending trend line and a lower ascending trend line.
In general, the symmetrical triangle pattern could be bullish or bearish, depending on the direction of the trend before the triangle formation and the conditions in the market. But in all cases, technical traders use this pattern to join an existing trend following the breakout point.
Everything About the Symmetrical Triangle Pattern in One Video
Here’s a video by our trading analysts on how to identify and trade the symmetrical triangle candlestick pattern.
How to Identify and Use the Symmetrical Triangle Candlestick Pattern?
A symmetrical triangle formation is found on price charts when the price is consolidating during a trend. It is a neutral chart pattern with two trend lines moving towards each other at a period when the market trades sideways and makes higher lows and lower highs.
When this happens, traders look for the price level at which both trend lines intersect, which serves as a breakout level.
Let’s see an example.

In the EUR/GBP 30-minute chart above, we can see the price consolidation phase following a bullish movement. The price action trades sideways with lower highs and higher lows and eventually, the two converging trend lines meet.
For traders, this is the perfect entry level with a stop loss at the lowest level of the previous ‘bearish’ price swing.
Taking this information into account, here are the steps you need to take when trading the symmetrical triangle candlestick pattern:
- Identify price consolidation during a bullish or bearish trend
- Find and draw a descending upper trendline with lower highs and an ascending lower trendline with higher lows
- Add Fibonacci retracement levels
- Enter a trade in the direction of the breakout. It’s advisable to wait for the first candle after the breakout to close below or above the trend line
- Set a stop-loss order and use a risk-reward ratio
How to Trade the Symmetrical Triangle Candlestick Pattern?
Like many other chart patterns, to effectively trade the symmetrical triangle pattern you’ll have to find the breakout level. Since the symmetrical triangle is a continuation chart pattern, you’ll be looking to enter a position in the direction of the previous trend.
To help you understand how the symmetrical triangle pattern works, below we are going to show you the two types of symmetrical triangle patterns in combination with Fibonacci levels. We’ll also highlight where you need to enter a position and at what price level you should place a stop-loss order and a take-profit target.
Bullish Symmetrical Triangle Pattern and Fibonacci Retracement Levels
The bullish symmetrical triangle is a bullish continuation pattern that signals traders when and where to join an upward trend. As you can see in the chart below, the pattern is formed during a trend by two converging trend lines that form price consolidation and a ranging market.
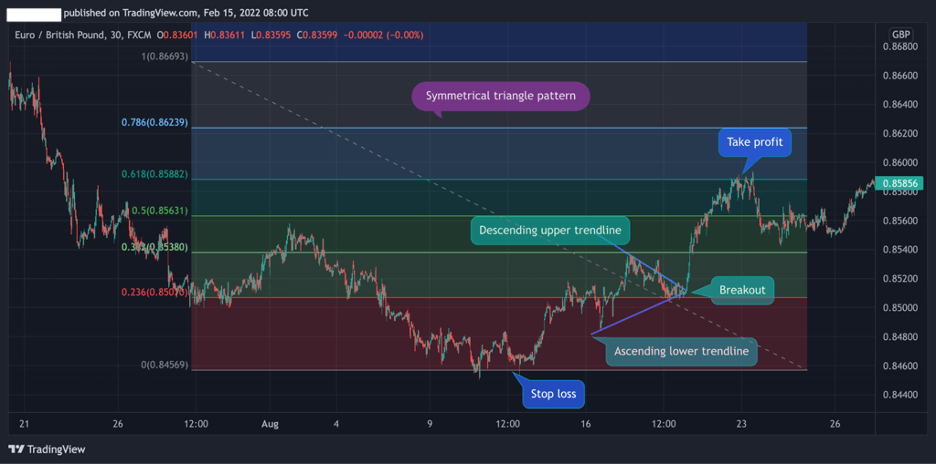
Adding Fibonacci levels to the chart helps us confirm the breakout and find the correct levels for stop-loss and take-profit orders. Evidently, the breakout occurs slightly above the 23.6% level.
For stop-loss, you’ll be looking to insert an order below the lowest price level of the previous trend. Take profit target should be located at 50%, 61.8%, or 78.6% levels.
Bearish Symmetrical Triangle Chart Pattern & Fibonacci Retracement Levels
The bearish symmetrical triangle pattern works the same as the bullish one but in the opposite direction. This means you’ll be looking for the pattern after a downward trend, trying to enter a selling position.
In the EUR/GBP 30-min chart below, we can see how the two converging trend lines are formed following a bearish trend and eventually connect.

In this case, a trader will enter a selling position when the price breaks the breakout level (in the chart, confirmed with the 61.8% level).
A stop-loss will be placed at the highest level before the triangle was formed (around the 50% Fibonacci level).
Finally, the take profit target could be located at the 78.6% level or at the lowest level of the previous trend (as happened in the above example).
The Symmetrical Triangle Candlestick Pattern – Pros and Cons
These are the most common pros and cons of trading the symmetrical triangle candlestick pattern.
Pros
- Offers a clear take profit target and stop-loss placement
- A very effective and reliable pattern when used in combination with Fibonacci levels
- A common and popular chart pattern
Cons
- False breakouts are common with symmetrical triangles
Key Takeaways
Below, we have summarized the main findings of symmetrical triangles:
- Symmetrical triangles are continuation chart patterns that appear during a bullish or bearish trend and indicate that the existing trend is likely to continue
- The pattern is characterized by price consolidation and two converging trend lines that connect and create a clear breakout point
- When trading the bullish and bearish symmetrical triangle patterns, it is best to use Fibonacci levels and the measuring technique to confirm the pattern and to identify stop loss and take profit levels
Risk Disclosure: The information provided in this article is not intended to give financial advice, recommend investments, guarantee profits, or shield you from losses. Our content is only for informational purposes and to help you understand the risks and complexity of these markets by providing objective analysis. Before trading, carefully consider your experience, financial goals, and risk tolerance. Trading involves significant potential for financial loss and isn't suitable for everyone.


