One of the most basic chart formations is the inside day candlestick pattern. If you are not familiar with the inside day price bar, then read on to learn more about how to spot, interpret, and trade the inside day candle.
- The Inside Day Candle pattern, a subset of candlestick trading patterns, serves as a key indicator of market consolidation or indecision.
- It is identified when a candle is completely contained within the price range of the previous day’s candle, signaling a potential pause in the prevailing trend.
- Traders often use this pattern to gauge market sentiment, employing it as a precursor to breakout strategies or trend reversals, especially in volatile markets.
Now, let us provide with more resources around this candlestick pattern and see what is included in this article.
- What Is The Inside Day Candle?
- How To Identify And Use The Inside Day Candle Pattern In Trading?
- What are the Types of the Inside Day Candle?
- Inside Day Trading Strategies And Examples
- What are the Benefits and Limitations of the Inside Day Candle Pattern
- What’s the Difference Between the Inside Day Candle and the Harami?
- Key Takeaways
- Frequently Asked Questions (FAQs)
What Is The Inside Day Candle?
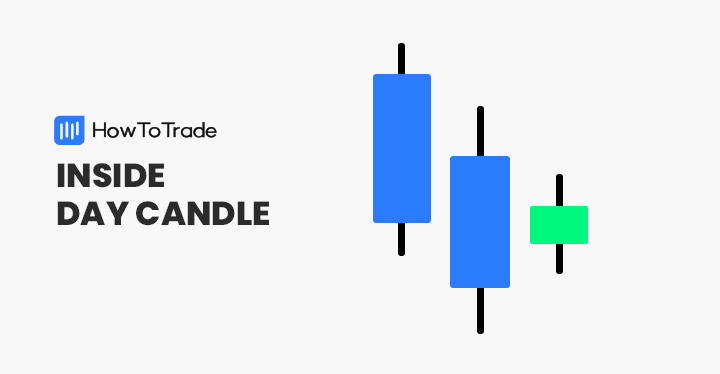
The inside day candlestick is a price bar that establishes a periodic range between the high and low of the previous trading day. It is a two-bar pattern that is used in a variety of unique trading strategies.
Forex traders interpret the inside day chart pattern as a signal of market consolidation or pending breakout. Its flexibility is conducive to executing many intraday, swing, or inside day trading strategies.
How To Identify And Use The Inside Day Candle Pattern In Forex Trading?
Perhaps the best thing about the inside day candlestick patterns is that they are user-friendly. Regardless of your experience level, identifying and using the formation is straightforward. Let’s see how it works:
Identification: It’s All In The Daily Chart
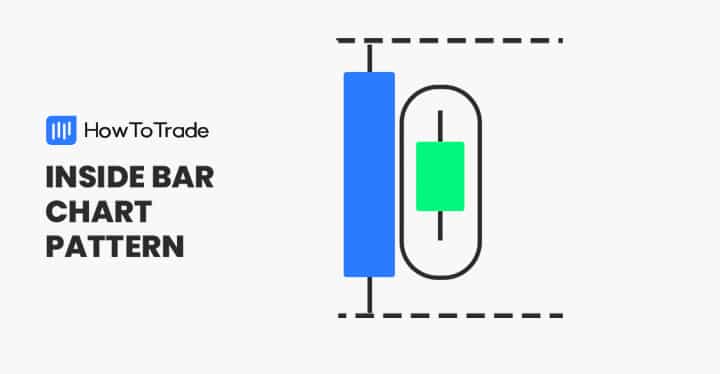
The inside day candle is easy to recognize. All you need is a Japanese candlestick daily chart. If a candle has the following characteristics, it will qualify as an inside candle:
- The candlestick’s high is less than the previous day’s high.
- The candlestick’s low is greater than the previous day’s low.
Visually, the current candle is engulfed by the previous day’s candle. Thus, it is considered an inside pattern due to its compressed trading range.
What are the Types of the Inside Day Candle?
The Inside Day cande comes in two types: the bullish and the bearish.
1. Bullish Inside Day Candle
Inside days offer abundant information to active traders that rely on technical analysis. An inside day candle is considered bullish when it satisfies the following criteria:
- The candle’s closing price is greater than its opening price.
- The inside day occurs within a pronounced uptrend.
A forex trader may be inclined to execute a buy or long inside day trading strategy if deemed bullish.
2. Bearish Inside Day Candle
Contrary to bullish inside days, bearish inside days suggest forthcoming sell-side pressure. An inside day is considered bearish when the conditions below are satisfied:
- The candle’s closing price is less than its opening price.
- The inside day occurs within a pronounced downtrend.
The bearish inside day will typically occur within a broader bear market. Accordingly, sell-side strategies may be executed.
Inside Day Trading Strategies with Examples
Active traders interpret the inside day pattern as being a signal of consolidation. From a day trading strategy standpoint, this is ideal for range and breakout trading strategies.
Let’s check these two most common trading strategies for the inside day candle pattern.
Example 1: Range Inside Day Trading Strategy
Range trading is a strategy where the trader anticipates price action will remain flat or in a smaller trading range. In this way, inside days can be profitable by selling the upper extreme and buying the lower extreme of the trading range.
Range Trading: Example
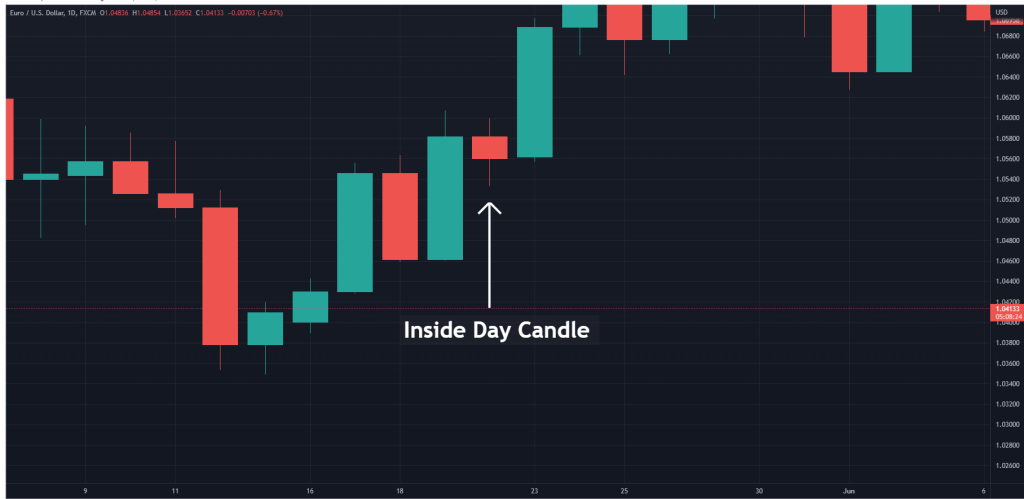
Here’s an example of how one should trade the inside day candle pattern in a ranging market.
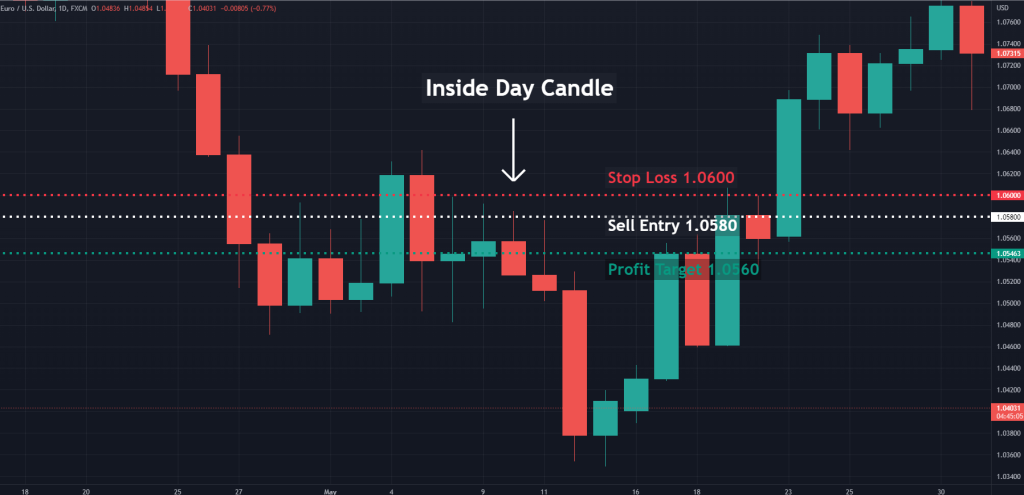
The EUR/USD chart above gives us a good look at how to trade an inside bar rotational strategy. Here’s the process:
- The inside day pattern was identified.
- A sell order was entered at 1.0580, beneath the current day’s high.
- A stop-loss order was located at 1.0600, above the prior day’s high.
- A profit target was placed at 1.0560, near the center of the inside day’s range.
- Upon the profit target being hit, a 20 pip profit was realized.
Example 2: Breakout Inside Day Trading Strategy
An inside bar often precedes a directional move in price. And, when occurring within a pronounced trend, it may be viewed as a continuation pattern. Traders attempt to join the breakout direction via buying above the inside day’s high or selling beneath the low.
Now, let’s see an example of trading the breakout when spotting the inside day candle pattern.
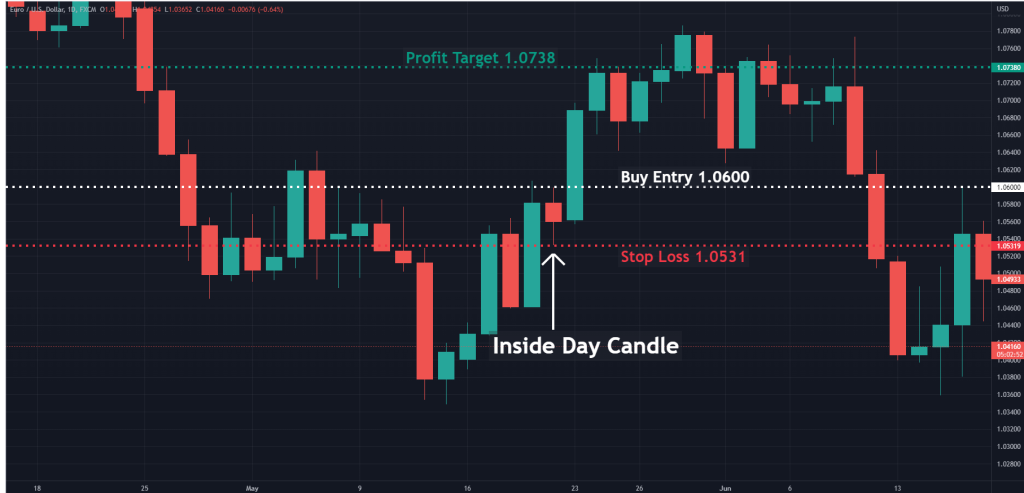
Here’s how the EUR/USD breakout above was traded:
- The inside day pattern was identified.
- A buy order was placed above the inside day’s high at 1.0600.
- A stop-loss order was placed beneath the inside day’s low at 1.0531.
- A profit target was located at 1.0738, adhering to a 1:2 risk/reward ratio.
- Upon the profit target being hit, a 138 pip gain was realized.
What are the Benefits and Limitations of the Inside Day Candle Pattern?
All technical indicators feature a collection of unique pros and cons. Below are a few of the most important ones for inside day patterns.
Pros
- Inside day candles frequently occur in all asset classes. From the stock market to crypto, inside days are exceedingly common.
- Inside bars may be used to buy or sell a product. This enhances the trader’s strategic alternatives and boosts potential opportunities.
- The formation may be effectively traded in both trending and rotational markets.
Cons
- Daily ranges can be large and expensive to trade correctly.
- Inside candles tend to produce false breakout signals during flat or sideways markets.
- Inside day range trades often take a significant time to realize a profit or loss. This ties up capital and may lead to opportunity costs.
The inside day candle is one of the most popular chart patterns used by technical traders. Below are a few things to know before implementing this powerful tool into your trading strategy.
- The inside day bar is a two-candle pattern. It develops when the current daily bar high and low falls within the high and low of the previous day.
- The pattern may be either bullish or bearish. This flexibility allows the indicator to function as either a buy or sell signal.
- Inside days are the basis for many trend-following or rotational trading strategies.
- Although often effective, inside candle strategies can be expensive and difficult to trade effectively in whipsaw market conditions.
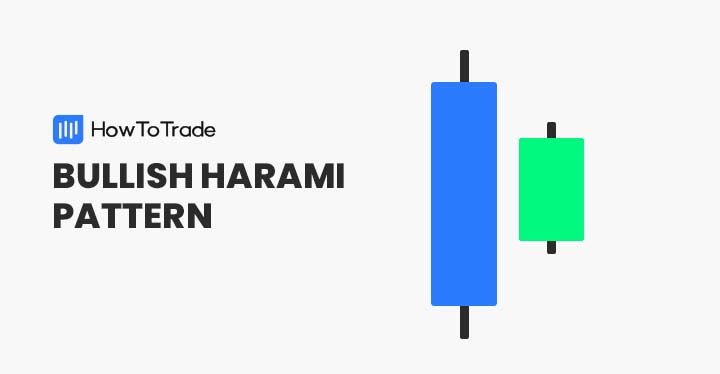
What’s the Difference Between the Inside Day Candle and the Harami?
The Harami is a candlestick pattern whose premise is very similar to the Inside Day’s. However, they have some characteristics that set them apart.
For instance, any daily candle whose high and low range are contained by the high and low range of the previous daily candle is an inside day candle. And any candle whose open and close range (the body range) are contained within the previous candle’s open and close range (body range).
Notice that the emphasis here is the high and low range for the Inside day and the open and close range for the Harami. Another key difference is in their interpretation. An inside day is more commonly used as a continuation pattern, while the Harami is a reversal pattern.
Having given these distinctions, you’ll still find that many inside day candles still look like the Harami. So, one way to know which one to trade is to add context to the chart. If you’re in a strong trend, chances are that it’s an Inside Day pattern, where the price is only taking a break before continuing the trend. If you notice a weakening trend and something similar to the pattern shows up, you might have a Harami in your hands, signaling a potential reversal.
This is where being able to tell the trend comes into play. For most traders, simple indicators like the Moving Average and the Moving Average Convergence Divergence may be of help.
Frequently Asked Questions about the Inside Day Candle
Here are a few of the most frequently asked questions regarding the inside day candle.
Is the inside day candle reliable?
Generally speaking, yes. However, no chart pattern or technical indicator is 100% accurate. Be sure to trade inside candles while adhering to prudent risk management parameters.
Which is a better inside-day trading strategy — range or breakout?
One is not inherently superior to the other. Ultimately, a strategy’s potency will stem from the trader competently reading price action and discerning the market state.
Can I trade inside candles on intraday timeframes?
You can trade inside candles on intraday timeframes. However, these patterns will then be called inside bar candles, not inside day. The inside day is reserved only for the daily timeframe. Many traders who utilize day trading and scalping strategies often use the inside day and Inside bar candle patterns to enter positions. However, the pattern’s efficacy may decrease as periodicities become compressed.
Risk Disclosure: The information provided in this article is not intended to give financial advice, recommend investments, guarantee profits, or shield you from losses. Our content is only for informational purposes and to help you understand the risks and complexity of these markets by providing objective analysis. Before trading, carefully consider your experience, financial goals, and risk tolerance. Trading involves significant potential for financial loss and isn't suitable for everyone.