


The falling wedge is a bullish chart pattern that signals a buying opportunity after a downward trend or mark correction. When the pattern occurs, it can be interpreted as a trend reversal or continuation pattern and can help traders find trading opportunities.
In this article, we’ll explain how to identify and use the falling wedge bullish reversal pattern as a trading strategy. Read on to learn more about this bullish pattern.
What is the Falling Wedge Pattern?
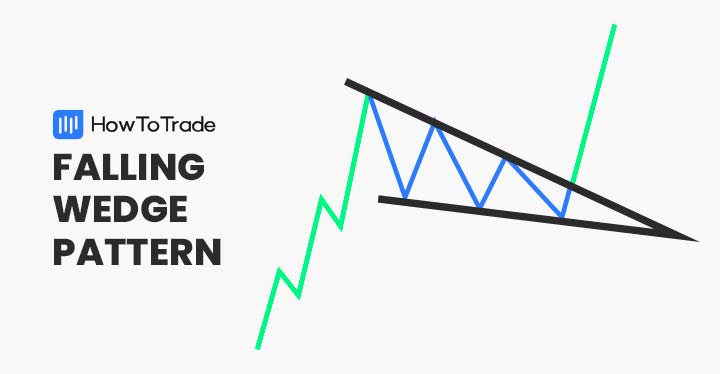
The falling wedge pattern is a bullish trend reversal chart pattern that signals the end of the previous trend and the beginning of an upward trend. In the vast majority of cases, the pattern appears after a downtrend and is considered a trend reversal pattern, however, in some cases, it can also be found within a trend and can be interpreted as a continuation pattern.
Regardless, the falling wedge pattern, much like the rising wedge pattern, is a useful chart pattern that occurs frequently in any financial instrument and in any timeframe. Traders often interpret the pattern as a slowing momentum indicator and a price consolidation mode.
When the falling wedge breakout indeed occurs, there’s a buying opportunity and a sign of a potential trend reversal.
How to Identify and Use the Falling Wedge Pattern?
To identify a falling wedge pattern, the first thing you need to find is a price consolidation after a downward trend. Then, you need to identify two lower highs and two (or three) lower lows.
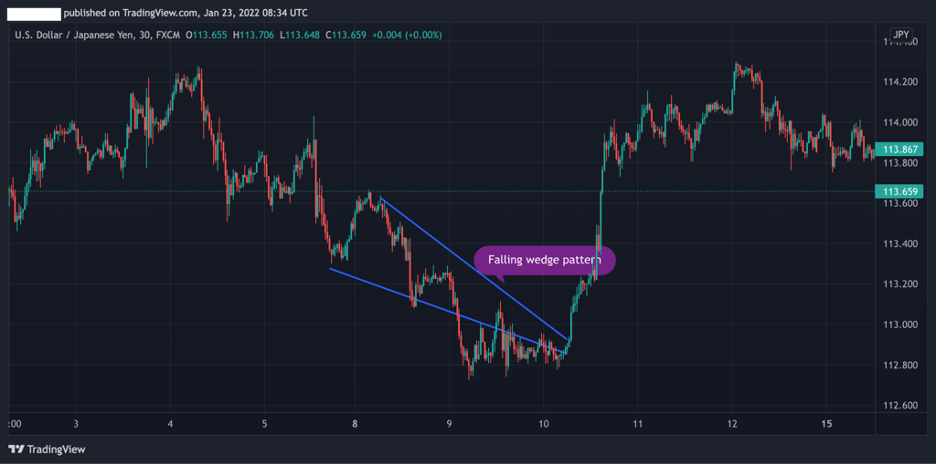
For example, let’s take a look at the USD/JPY 30-min chart. As you can see, the falling wedge pattern is formed at the end of the downtrend with three lower highs and two lower lows, and most importantly, a price consolidation at the end of the downward trend.
As soon as the price breaks above the resistance trend line, an entry point is signaled and the trader will take a long buying position.
Taking the above into consideration, there are several steps you need to follow in order to identify and use the falling wedge pattern:
- Identify an existing downward trend or a long bullish trend in a currency pair
- Draw two trend lines – the bottom support line and upper resistance line
- Wait for a price consolidation and the contraction of support and resistance lines
- Place a buying order once the falling wedge appears and the price break above the resistance trend line
- Set a stop-loss order at the same resistance trend line
How to Trade the Falling Wedge Pattern?
As we previously discussed, the falling wedge pattern can be formed after a prolonged downtrend or during a trend. Or, in other words, it may indicate a trend reversal or trend continuation.
Nonetheless, regardless of the market condition, you always need to find the same pattern formation and follow the same rules when using this pattern to predict future price movements.
Below we are going to show you the two ways in which you can find the falling wedge pattern.
1. Reversal Trend
Typically, the falling wedge pattern comes at the end of a downtrend where the previous trend makes its final move. When this happens, it’s certainly easier to identify the pattern and enter a position in the other direction with a stop-loss order.
Still, because there’s confusion in identifying falling wedges, it is advisable to use other technical indicators in order to confirm the trend reversal.
To do so, some of the most common and useful trend reversal indicators include the Relative Strength Index (RSI), moving averages, MACD, and Fibonacci retracement levels.
With that in mind, let’s see an example of the falling wedge pattern bullish trend reversal on a price chart:
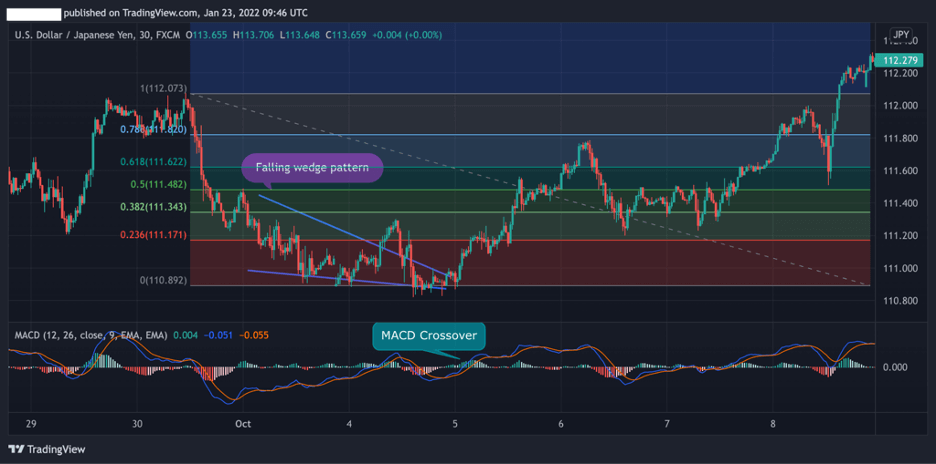
In the USD/JPY chart above, the price consolidates following a downward trend and the falling wedge pattern is formed. Additionally, the integration of Fibonacci retracement levels and the MACD indicator helps us in confirming the trend reversal and placing a stop loss and profit price target.
In terms of technicality – the breakout above the resistance trend line signals the end of the downtrend. As soon as the first candlestick is completed, the trader will enter a long position with a stop loss at the support line. A good take profit could be somewhere around the 38.2% or 50% Fibonacci levels.
2. Trend Continuation
The second way to trade the falling wedge pattern is to find a long bullish trend and buy the asset when the market contracts throughout the trend.
Frankly, this method is a bit more complicated to use, however, it offers good entry levels if you succeed in identifying a sustainable trend and looking for entry levels.
Let’s see how the falling wedge continuation pattern looks in reality.
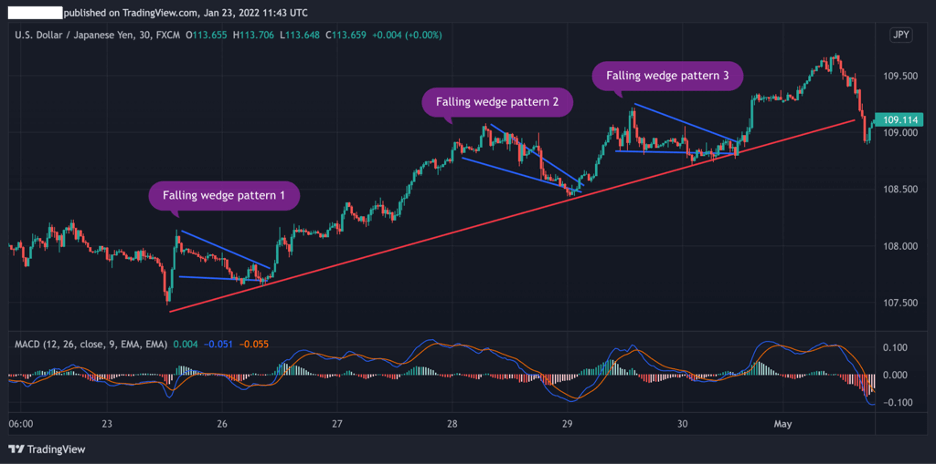
As you can see in the chart above, every time the price touches the main trend line and a falling wedge pattern appears – a buying opportunity emerges.
The Falling Wedge Pattern – Pros and Cons
Here are the most common pros and cons of trading the falling wedge pattern:
Pros
- Simple to identify
- A frequently occurring reversal pattern
- One of the most accurate and reliable chart patterns in technical analysis
- Works well with other technical indicators such as Fibonacci ratios, moving averages, MACD, and RSI
Cons
- There’s a confusion about the type and implication of the falling wedge pattern – reversal or continuation
- Requires the knowledge of other technical indicators
Everything About the Falling Wedge Pattern in One Video
You can check this video for more information on how to identify and trade the falling wedge pattern.
Key Takeaways
In conclusion, here are the key takeaways:
- The falling wedge pattern is a frequently occurring chart pattern that appears at the end of a bullish trend or during a bullish trend
- The pattern can signal a trend reversal or continuation, depending on the condition in the market
- It is best to combine the falling wedge pattern with other technical indicators including moving averages, RSI, MACD, and Fibonacci retracement levels
- When using the falling wedge pattern, a trader will be looking for the breakout of the upper trend line to buy the currency pair
Risk Disclosure: The information provided in this article is not intended to give financial advice, recommend investments, guarantee profits, or shield you from losses. Our content is only for informational purposes and to help you understand the risks and complexity of these markets by providing objective analysis. Before trading, carefully consider your experience, financial goals, and risk tolerance. Trading involves significant potential for financial loss and isn't suitable for everyone.

