The Adam and Eve chart pattern. Not something you would expect to hear in the trading world, right? Indeed, the Adam and Eve formation is a rare chart pattern made of a double bottom or top formation. Much like double bottoms and double tops, Adam and Eve is a very accurate and helpful chart pattern for finding trading signals.
- The Adam and Eve chart pattern represents a distinctive formation that indicates potential trend reversals in the market.
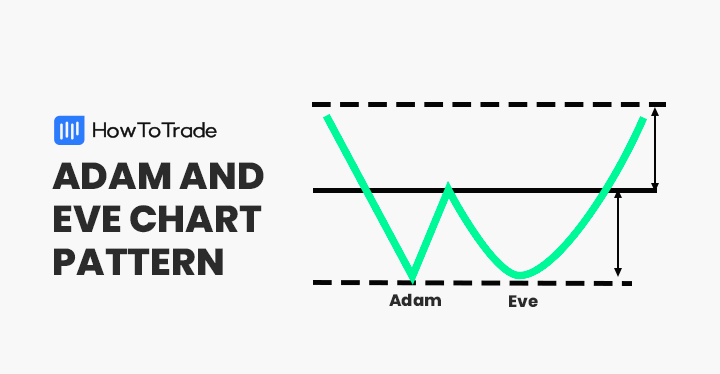
- Characterized by a sharp, V-shaped ‘Adam’ peak followed by a more gradual, rounded ‘Eve’ trough, this pattern is a key tool for technical analysis.
- Traders often use the Adam and Eve pattern to identify buying opportunities, with the completion of the Eve formation signaling a possible bullish turn.
This guide will discuss identifying the Adam and Eve pattern and how to trade it correctly when the pattern appears.
- What is the Adam and Eve chart pattern in Trading?
- What are the 2 Types of the Adam and Eve pattern?
- How to identify and use the Adam and Eve pattern in trading?
- How to trade the Adam and Eve candlestick pattern
- What are the Benefits and Limitations of the Adam and Eve pattern?
- Is the Adam and Eve Pattern Different From the Double Top or Double Bottom Chart Pattern
- Key takeaways
What is the Adam and Eve Chart Pattern in Trading??
Adam and Eve is a bullish and bearish reversal chart pattern that appears in a downtrend or uptrend. Thomas Bulkowski first mentioned it in his book, “Encyclopedia of Chart Patterns,” and until now, it is a relatively unfamiliar classical chart pattern to many traders worldwide.
In essence, Adam and Eve is a variation of double top and double bottom patterns and is only slightly different from the traditional double bottoms/tops. The pattern is marked by the first bottom or top, the Adam. Then, the price moves up or down and creates another U-shaped area where we can see Eve.
So, instead of having two peaks like in the double top or double top pattern (or three peaks for the triple bottom and triple top pattern), the Adam and Eve pattern is formed by two highs—the first is a peak, while the other is round.
Overall, it is an excellent chart pattern for finding entry levels as it double-confirms that the price fails to break above or below a specific price level.
What are the 2 Types of the Adam and Eve Chart Pattern in Trading?
There are two types of Adam and Eve patterns: double top and double bottom chart patterns.
1. Adam and Eve Double Bottom
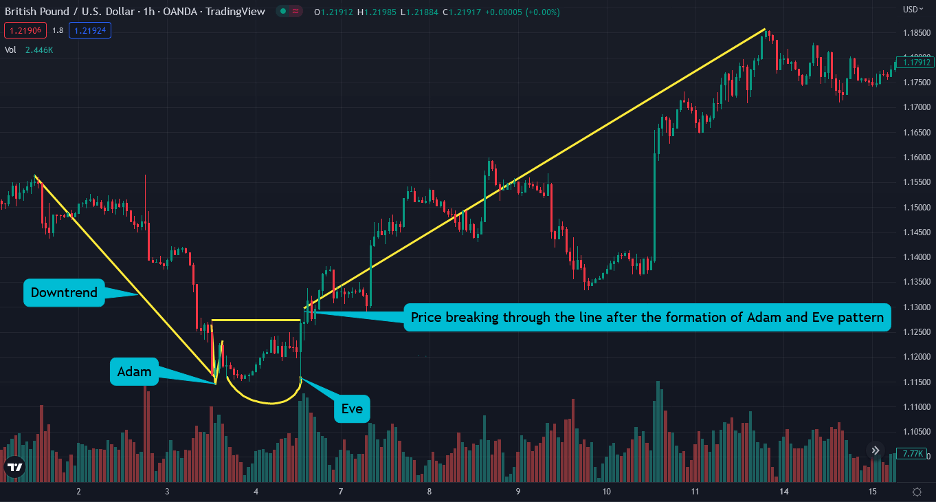
Adam and Eve double bottoms are formed in a downtrend and create two bottoms before the price moves upward—the first bottom is in the shape of a V (Adam), a peak at the support line, while the second bottom is in the shape of a U (Eve).
In the chart below, you can see the Adam and Eve double-bottom pattern.
As you can see, the first low level has one bottom price, while the second wave has several bottoms with a round shape of the U letter. Once the price breaks above the neckline level, it immediately rises to start a new bullish movement.
2. Adam and Eve Double Top
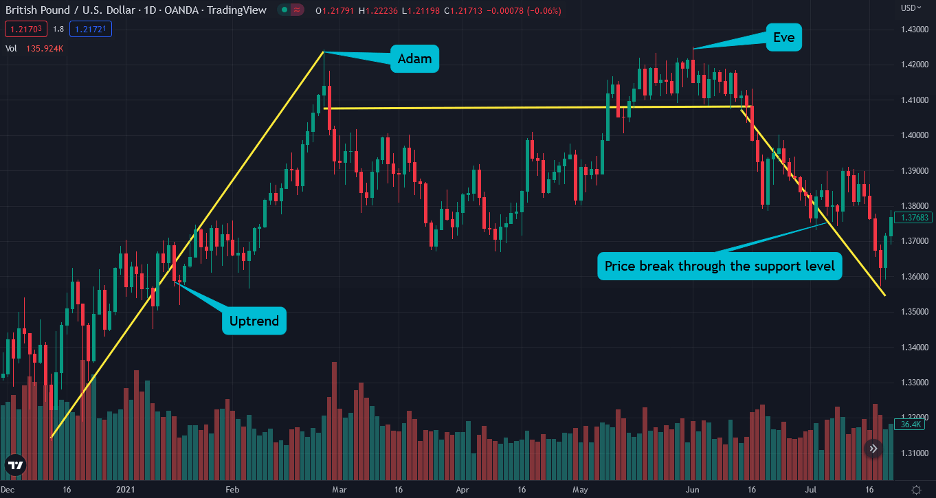
The Adam and Eve double top is formed during an uptrend and makes two tops before the bearish reversal – the first is in the shape of an upside V (Adam), and the second is in the shape of an upside U (Eve).
As you can see from the chart above, the first high level has one top price, while the second wave has several tops with a round shape of an inverted U letter. Once the price breaks below the neckline level, it immediately falls to start a new bearish movement.
How to Identify the Adam and Eve Chart Pattern in Trading?
Here are some crucial factors that will help you identify the Adam and Eve pattern.
1. Observe the current market trend
As mentioned earlier, Adam and Eve is a bullish and bearish reversal pattern. So, first, you need to identify the market trend and then look for the pattern. So, in a bullish trend, you’ll expect to find a double-top Adam and Eve pattern. And in a bearish trend, you’ll expect to find the double-bottom Adam and Eve chart pattern.
2. Locate the potential first bottom or top (Adam)
In a downtrend, the price must make a sharp bottom with a price peak. You can identify the sharp bottom as it appears in the shape of a V. The price makes a bottom and then moves up sharply with a large upswing. On the other hand, when the price makes an opposite V-shaped top in an uptrend, we can see Adam at the peak of an uptrend.
3. Watch for the formation of the second bottom and top (Eve)
In Adam and Eve’s double bottom, the price action firstly creates the Adam shape, makes a bottom V, moves downwards again, and finally creates a U-shaped bottom. Conversely, in Adam and Eve’s double top, the price makes a sharp top, moves upwards again, and develops an inverted U-shaped top.
4. Use a Volume Indicator
As the Adam and Eve pattern is normally characterized by high trading volume during the pattern’s formation, it is best to add a volume indicator. This may only serve as a confirmation of the pattern, albeit a very strong one. There are times, though, when the pattern forms without a significant change in volume.
How to Trade the Adam and Eve Chart Pattern
Trading the Adam and Eve pattern is super simple. All you have to do is identify the pattern correctly and know the proper levels of when and where to enter and exit a trade.
Here are two ways to show you how to use the Adam and Eve pattern in forex trading.
1. Adam and Eve Double Bottom Breakout Strategy
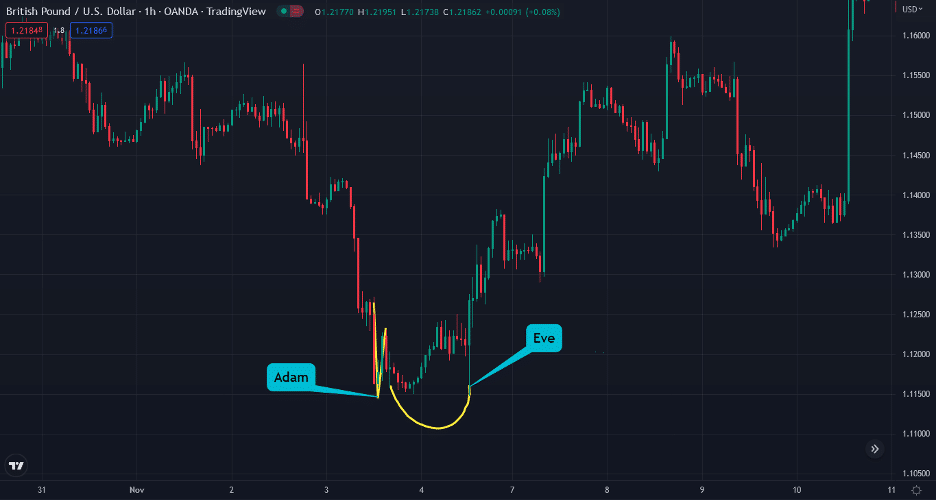
As previously mentioned, the Adam and Eve pattern creates a support level in the double bottom, meaning Adam and Eve have the same support level. So, whenever the price breaks above the highest resistance level of the Adam or Eve chart formation, you get a signal to enter a long position.
In the GBP/USD chart below, you can see how the price breaks the neckline level of Adam and Eve, and a new trend begins. Around this area, there is a high volume, which confirms the buying pressure.
2. Adam and Eve Double Top Breakout Strategy
In a double-top pattern, the Adam and Eve pattern makes two tops. These tops signify resistance levels, with the first top being a peak while the other creates a rounded shape of high price levels. Also, when the pattern appears, we can draw a support neckline level. Ultimately, the signal is given when the price breaks the support level.
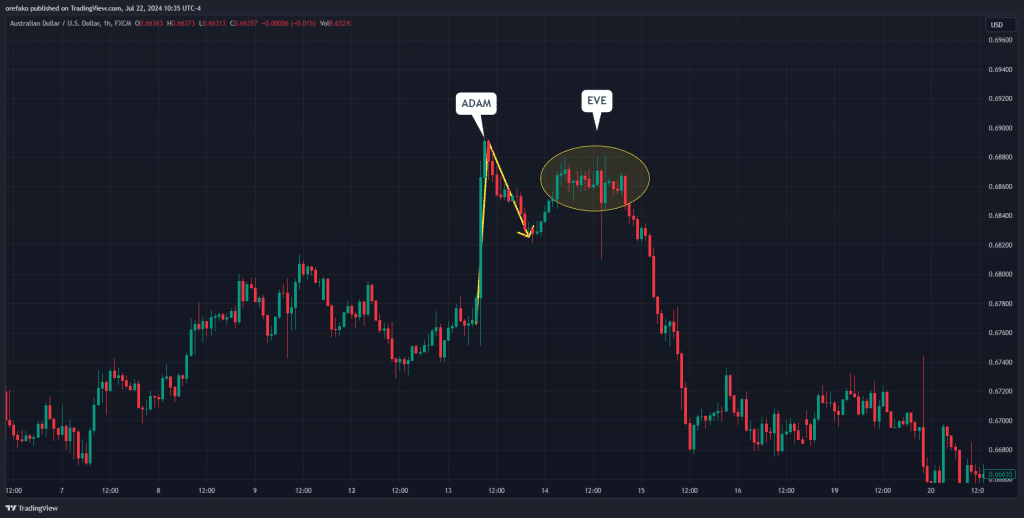
Let’s use an example. In the GBP/USD chart below, you can see how the price enters a consolidation mode after the first peak. At this point, you may identify a pattern that is very similar to the Wyckoff distribution phase. Then, once the price fails to break the same resistance several times in the second wave, the Adam and Ev pattern is valid.
Finally, when the price breaks the lowest level of Adam and Eve, a new trend begins. Therefore, a good level to enter a trade upon identifying the Adam and Eve chart pattern is when the price breaks below the support level.
Finally, stop loss is located at the resistance level, and the take profit target could be placed at the lowest price swing level before Adam’s formation.
What are the Benefits and Limitations of the Adam and Eve Chart Pattern?
Like many other chart patterns, the Adam and Eve chart pattern has ups and downs. So, let’s see the pattern’s pros and cons.
Pros
- If the pattern is identified correctly, Adam and Eve present an exact entry point level.
- The pattern is easily recognizable.
- Once the price breaks through support (in double top) and resistance (in double bottom) levels, it is almost certain to continue in the direction of the breakout.
Cons
- Even after making double tops and bottoms, the price can continue in the previous direction rather than reverse, creating a false signal.
- The Adam and Eve pattern usually doesn’t work if there is a low trading volume in the specific market.
Is the Adam and Eve Pattern Different From the Double Top or Double Bottom Chart Pattern
The Adam and Eve pattern can be a type of double top or double bottom pattern, but it has some specifics. With the Adam and Eve chart pattern, one of the tops or bottoms must have a sharp V-shape, while the second top or bottom has more of a U-shape.
Key Takeaways
Below, you can find some of the key takeaways about the Adam and Eve pattern.
- The Adam and Eve pattern is a slightly different variation of the double top and bottom chart pattern that signals the start of a new trend.
- When the bullish version appears, the first bottom, the Adam, has a V-Shaped. After Adam, the price makes a U-shaped consolidation phase, thus forming Eve. The same applies to the bearish version.
- The best way to trade with the pattern is by utilizing the breakout trading strategy; Therefore, when the price breaks above the resistance line or below the support line, you should enter a trade with a stop loss at the neckline level.
- Volume is an integral part of Adam and Eve, as it confirms the buying or selling pressure and, thus, provides a strong signal for a trend reversal.
Risk Disclosure: The information provided in this article is not intended to give financial advice, recommend investments, guarantee profits, or shield you from losses. Our content is only for informational purposes and to help you understand the risks and complexity of these markets by providing objective analysis. Before trading, carefully consider your experience, financial goals, and risk tolerance. Trading involves significant potential for financial loss and isn't suitable for everyone.