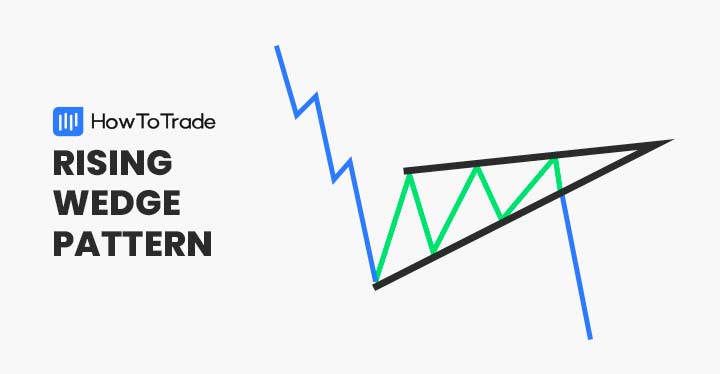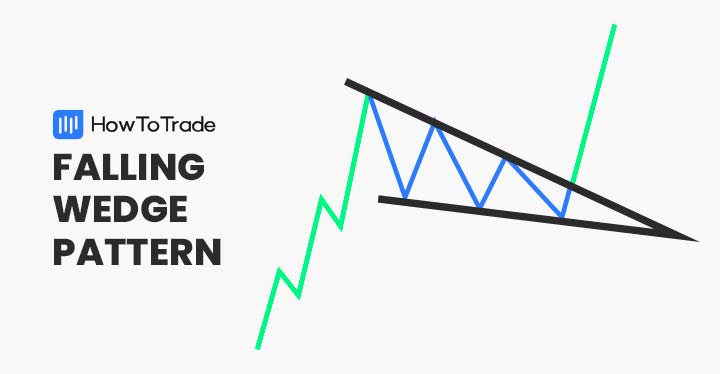
Three methods are trend continuation patterns that can appear during an ongoing market uptrend or downtrend. The rising three methods refer to a situation whereby the pattern is formed during an uptrend, while a falling three methods pattern refers to a case whereby the pattern is formed during a downtrend.
In this article, we will explain the rising and falling three methods patterns, how to identify them and use them to find profitable trades.
- What is the Rising and Falling Three Methods candlestick pattern?
- How to identify the Rising and Falling Three Methods pattern in trading?
- How to trade the Rising and Falling Three Methods candlestick patterns?
- The Rising and Falling Three Methods patterns – Pros and cons
- Key takeaways
- Frequently Asked Questions (FAQs)
What is the Rising and Falling Three Methods Candlestick Pattern?
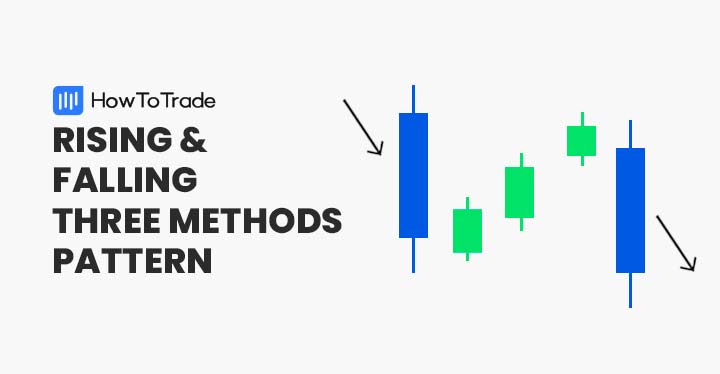
The rising and falling three methods are continuation chart patterns that are made of five candlestick formations. They appear during an existing trend and represent a price correction or taking-profit mode before the price continues in the same direction as the prior price movement.
The rising three methods is a bullish continuation candlestick pattern made of one long bullish candlestick followed by three small bearish candles and another large positive candle.
Conversely, the falling three methods is a bearish candlestick pattern characterized by a long first bearish candle followed by three tiny bullish candles and another long bearish candle.
The theory behind this chart pattern is that prices do not move in straight lines. Instead, there are wave movements and price corrections during a trend.
Similar to the bullish rectangle pattern or the Mat Hold pattern, the rising and falling three methods patterns help traders identify these minor pullbacks and provide them a solid indication to enter a position.
How to Identify the Rising and Falling Three Methods Pattern in Trading?
The three methods chart patterns are similar in structure to the Mat Hold pattern and the bearish and bullish pennants. It is relatively easy to recognize and has a high accuracy rate.
In structure, both the rising and falling methods formations consist of five candles and have the same chart formation. It’s also important to note that the three methods patterns rarely appear in their classic form. There are different variations, so you will have to be creative when identifying this chart pattern.
Still, there is a set of rules that you need to remember to recognize the rising and falling three methods patterns:
Identify the Rising Three Methods Chart Pattern
The rising three methods candlestick pattern is a bullish continuation formation that helps traders find an entry point during an existing bullish trend. To identify the pattern, here’s what you need to remember:
- The rising three methods pattern appears during an uptrend
- The pattern is made of five candlesticks – A long bullish candle followed by three bullish candles, and another fifth bullish candle
- The last bullish candle must close above the first and second candlesticks
Below you can see an example of the rising three methods chart pattern:

In the example above, the rising three methods pattern occurs during an upward trend and signals that the bullish trend pauses before it continues higher.
The five candlestick formation is formed with a first bullish candle followed by three bearish candles and a fifth long bullish candle that closes above the first and second candles and confirms that the bullish trend is expected to continue.
Identify the Falling Three Methods Chart Pattern
The falling three methods candlestick pattern works the same as the rising one. However, the difference is that it is a bearish continuation formation that helps traders find an entry point during an existing downtrend. Here are the conditions that must occur to recognize the falling chart pattern:
- The falling three methods pattern appears during a downward trend
- The falling three methods pattern consists of five candlesticks – A long bearish first candlestick followed by three bearish candles, and another fifth bearish candle
- The last bearish candle must close below the first and second candlesticks
Here’s an example of the falling three methods chart pattern:

As you can see, the falling three methods pattern is formed after the bearish trend has started. All the conditions have been met, as you can see in the above AUD/USD 1H chart.
The first candle is long and bearish, followed by three small bullish candles. Then, the last bearish candle closes below the first and second candles, indicating that the bearish trend is about to continue.
How to Trade the Rising and Falling Three Methods Pattern?
As already mentioned, the three methods patterns are not difficult to trade. And, like many other classical chart patterns, trading the rising and falling three methods requires a trader to use the breakout trading strategy.
Let’s see how trading these continuation chart patterns works:
1. Rising Three Methods Pattern and Fibonacci Levels
Trading the rising three methods means you are looking to join a bullish uptrend. You can make a buy trade when you can identify the rising three methods’ bullish continuation pattern with the above rules and conditions.
The main factors to consider are the best entry point, stop loss, and take profit target.
As always, we use Fibonacci levels to get a better perception of past performance and valuable support and resistance levels.

In the above example, the Fibonacci levels have been added to the price chart from the lowest to the highest level of the previous price swing.
Ironically, the highest level of the prior trend is slightly above the highest level of the fifth candle of the rising three methods pattern. This indicates that the trend is expected to continue.
However, we must use Fibonacci extensions to find a profit target in this case. Then, we place the first profit target at 23.6%, second at 38.2%, and third at 50.0% Fib level. Stop loss is located at the 78.6 Fibonacci level below the formation of the three rising methods.
2. Falling Three Methods Pattern and Fibonacci Levels
The falling three methods chart pattern is the opposite version of the rising three methods, meaning you’ll be looking to find an entry point to short-sell the asset.
You can use Fibonacci retracement levels to confirm an entry point, take a profit target, and determine where to place a stop loss.

The example above shows us that the lowest level of the fifth confirmation candle is also the 78.6% Fibonacci level. As a result, it is the ideal entry point for a short-sell transaction of the AUD/USD currency pair. Stop-loss is placed at the 61.8% level, and take-profit is placed at the 100% level, which is the lowest level of the previous price swing.
The Rising and Falling Three Methods Pattern – Pros and Cons
These are the most common pros and cons of trading the rising and falling three methods pattern:
Pros
- It is straightforward to identify the rising and falling three methods pattern
- Provides an entry point to join an existing trend
- Reliable and accurate chart pattern
Cons
- The rising and falling three methods pattern does not provide a clear profit target
Key Takeaways
Here are the key takeaways to remember about the three methods chart patterns:
- The rising and falling three methods are five-candle patterns that indicate the continuation of the existing trend
- The first and fifth candles move in the same direction while the three candles in the middle move in the opposite direction
- To trade the rising and falling three methods patterns, traders enter a position when the fifth last candlestick closes above or below the first and second candles
- When trading the three methods patterns, it is best to use Fibonacci levels to identify entry points, stop loss, and take profit targets
- Stop loss is typically placed above or below the first candle, and take profit is placed at the following Fibonacci level
Frequently Asked Questions (FAQs)
Here are some of the most frequently asked questions about the rising and falling three methods pattern in forex trading:
What is the meaning of the rising and falling three methods?
Three methods patterns occur when a trend pauses, and buyers or sellers can no longer push the asset price in the same direction. It is often associated with a profit-taking mode or a trend reversal. So, when the three methods trend continuation pattern is completed, there is a strong indication that the previous trend (before the formation) is likely to continue.
How can you identify the three methods candlestick patterns?
The three methods chart patterns are characterized by a first long (bullish or bearish) candle followed by three small candles in the other direction and another fifth long candle in the same direction as the first candle. If you have identified this chart formation, you can use the pattern as a trading signal.
Another way to find the rising and falling three methods patterns is to use a scanner that automatically sends you alerts when it detects these candlestick formations.
How accurate are the raising and falling three methods patterns?
The rising and falling three methods chart patterns are certainly among the most reliable and accurate patterns in technical analysis. Based on our research, we found that these patterns are accurate 70%-80% of the time.
Risk Disclosure: The information provided in this article is not intended to give financial advice, recommend investments, guarantee profits, or shield you from losses. Our content is only for informational purposes and to help you understand the risks and complexity of these markets by providing objective analysis. Before trading, carefully consider your experience, financial goals, and risk tolerance. Trading involves significant potential for financial loss and isn't suitable for everyone.