


A double top is a frequently occurring chart pattern that signals a bearish trend reversal, usually at the end of an uptrend. Much like the double bottom pattern, this pattern is commonly used in technical analysis by traders and analysts and is considered a reliable and easy-to-identify chart pattern.
In this article, we’ll show you everything you need to know about this pattern – how to identify, use and trade the double top bearish reversal pattern.
What is the Double Top Pattern?
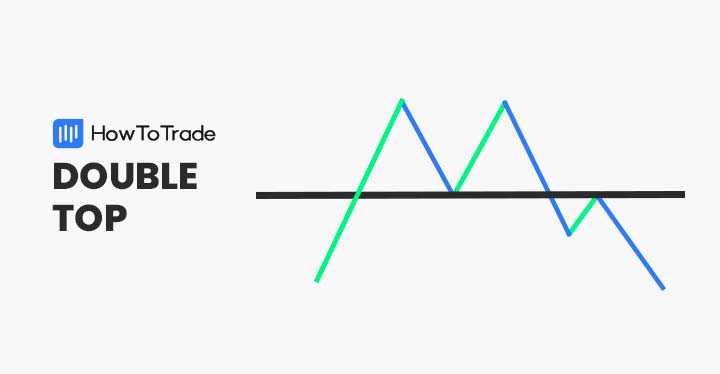
As the name implies, the double top chart pattern has two tops. Or, in other words – a retest and failure of the previous highest price. In the financial markets, the pattern forms after a bullish trend when a currency pair reaches two consecutive peaks, creating the shape of the “M” letter.
This formation signals a possible trend reversal, which is confirmed once the asset breaks below the support neckline. In terms of its characteristics, the double top pattern must include a first peak, a second peak, and a neckline.
The slowing momentum and price consolidation near the second peak typically indicate a bearish trend reversal. The pattern is commonly seen when an uptrend comes to an end and is confirmed by two last attempts to break below the resistance level.
How to Identify and Use the Double Top Pattern?
As we mentioned, a double top is a bearish technical analysis reversal pattern that forms once the asset tests two consecutive peaks followed by a breakout below the support line. In many cases, you’ll be able to identify the double top formation by seeing the letter “M” on a trading chart.
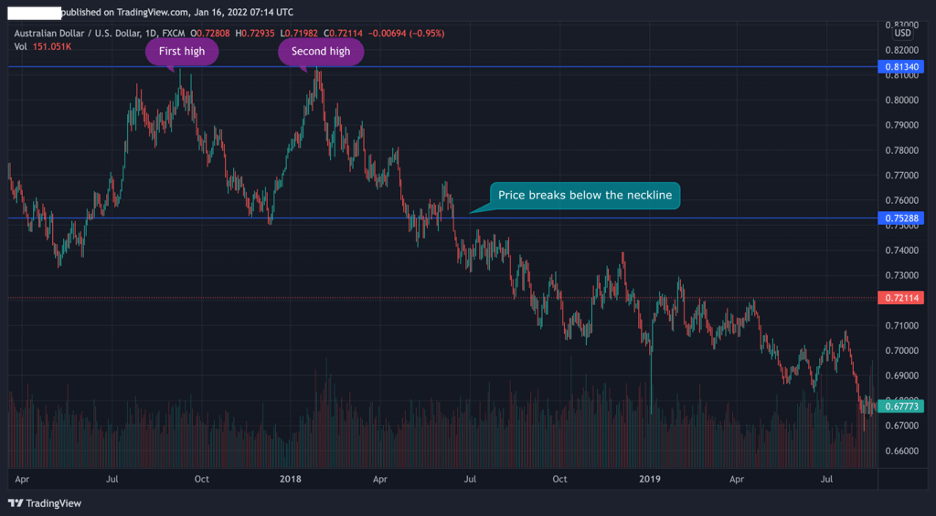
So, let’s see what the double top pattern really looks like on a trading chart. In the AUD/USD daily chart below, we can see a clear M shape – two tops and a neckline. And, once the currency pair broke the support neckline level, the trend reversal is confirmed with the price moving in a downward direction.
With the above in mind, below is a step-by-step process to help you identify and use the double top pattern in your trading:
- Find a retest of the first top and draw a resistance line at the first and second top price levels
- Try to identify the first and second tops and draw the neckline around these levels
- Wait until the first candle is completed after the price breaks below the neckline
- Enter a short-selling position with a tight stop-loss order at or below the neckline
How to Trade the Double Top Pattern?
Well, basically, you can find the double top pattern in any asset class, market scenario, and condition. Further, the double top is generally a very common chart pattern in different trading timeframes.
However, although this pattern is mostly identified and used by analysts and traders at the end of an uptrend, it can also be found in a ranging market. For that reason, below we’ll show you two examples where the double top pattern can be found.
Example 1: Double Top Chart Pattern at the End of an Uptrend
Much like the double bottom pattern, the double top pattern is mostly used to identify a trend reversal at the end of the previous market trend. This is because traders who use a double top pattern look for a trend reversal pattern, which usually is easier to identify at the end of an uptrend.
In the first example, you can see how the double top pattern is formed at the end of an uptrend and signals the beginning of a new bearish trend.
The two peaks that look like the letter “M” indicate a price consolidation, and once the forex pair has hit the neckline, it is a good entry-level for a short-selling position (or closing an existing long position).

Example 2: Double Top Chart Pattern in a Ranging Market
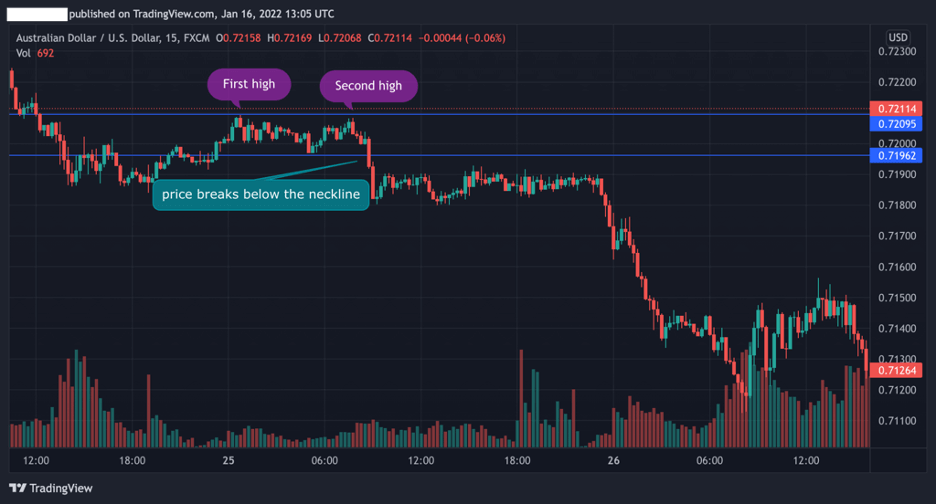
The second way you can use a double top pattern is to identify it in a ranging market. To be honest, it could be tricky because in many cases a double top pattern could be formed and bounce back again to trade around the resistance level, meaning creating a triple top pattern.
Nonetheless, whenever you are able to identify a double top formation in a ranging market followed by a breakout of the neckline – it is a good entry-level as long as you place a stop-loss order and work with a risk-reward ratio.
As you can see in the chart below, we found a pretty convincing double-top pattern in a range-bound market.
The Double Top Pattern – Pros and Cons
Here are the most common pros and cons of trading the double top chart pattern:
Pros
- When using the double top reversal pattern, there’s a high probability that the next bearish trend will be long and sustainable when the price breaks below the neckline
- The pattern can be seen in multiple chart time frames
- Can be identified in trending and ranging markets
Cons
- In some cases, the double top pattern can become a triple top pattern and the stop loss will be triggered
- Using the double top pattern trading strategy is more suited for day traders rather than long term investors
Everything About the Double Top Pattern in One Video
For more information, you can check this video by our trading analysts on how to identify and trade the double bottom pattern.
Key Takeaways
In conclusion, here are the key takeaways:
- The double top pattern is a bullish reversal chart pattern formation that looks like the letter “M”
- To identify the double top pattern, you need to see three main elements: first high, second high, and a neckline (at the support level)
- The double top formation is more effective at the end of a strong uptrend rather than in a ranging market
- To trade this pattern, you need to draw a resistance level and a neckline
- It is important to confirm that pattern with other technical analysis tools – Moving averages, RSI, Fibonacci retracement level, and MACD
- The best way to trade double topsis to wait until the price breaks the neckline with a stop-loss order and a risk-reward ratio
Related Chart Patterns to the Double Top Pattern
Here are some chart patterns that are closely related to the double top pattern in terms of structure and meaning.
Risk Disclosure: The information provided in this article is not intended to give financial advice, recommend investments, guarantee profits, or shield you from losses. Our content is only for informational purposes and to help you understand the risks and complexity of these markets by providing objective analysis. Before trading, carefully consider your experience, financial goals, and risk tolerance. Trading involves significant potential for financial loss and isn't suitable for everyone.


