Some chart patterns only occasionally appear on price charts. But when they do, they can provide excellent trading opportunities. One such pattern is the High Tight Flag Pattern, a rare candlestick formation that may give a strong signal for a massive price movement.
- The High Tight Flag pattern is a rare but potent candlestick formation appearing on price charts.
- When identified, this pattern can signal a potential for massive price movement.
- Recognizing the High Tight Flag pattern can act as a strong precursor to substantial price shifts in the market.
So, if you are keen to know more about this chart pattern, this guide is for you. We’ll show you how to identify the pattern and correctly trade it.
- What is the high tight flag pattern?
- What is the Psychology Behind the Formation of this Pattern?
- How Do You Identify the High Tight Flag Candlestick Pattern in Trading?
- How to trade the high tight flag pattern – Trading strategy
- The high tight flag pattern – Pros and cons
- What’s the Difference Between a High-Tight Flag and a Bullish Rectangle Chart Pattern?
- Key takeaways
- Frequently asked questions (FAQs)
What is the High Tight Flag Chart Pattern?
The high tight pattern is a rare bullish continuation pattern formed following a strong rally followed by a brief consolidation period. The combination of the rally and the consolidation form the flagpole and the flag. This formation signals that another bullish rally may be about to form, which is confirmed by the bullish breakout from the flag.
If you are familiar with flag patterns, you can consider high tight as part of the bullish flag pattern. Generally, the bullish flag comes in various shapes, like the rectangular and the tight bull flag. The tight flags are considered more reliable as they come after a long and significant bullish movement, and they create a good entry point with tighter stop-losses.
What is the Psychology Behind the Formation of this Pattern?
The idea behind the high tight flag pattern is that even though the price has increased significantly in the previous price trend, the bullish momentum is so strong that after the period of consolidation, the price is likely to continue in the upward direction.
In fact, the high and tight flag pattern is among the most bullish chart patterns in technical analysis. The high tight flag is technically characterized by an upswing where the price doubles by at least 80% to 100% over the last 4-8 weeks. That is why the pattern appears more often in the stock market than in the forex market.
That said, you can still identify the high flag pattern in forex trading, though you may have to ignore the first rule of an 80% to 100% increase over the last 4-8 weeks and use it in any scenario of a substantial price rise.
How Do You Identify High Tight Flags in Trading?
As mentioned earlier, high tight flag patterns appear rarely, so identifying them can be slightly challenging. Also, the pattern usually occurs in the stock market more often than in the forex market. You’re more likely to find the pattern on the charts of stocks that have consistently retained strong fundamentals over a long period.
Still, once you learn how to identify the pattern, you will find that it is among the most rewarding chart patterns in technical analysis. That is largely because the pattern enables you to join an existing trend with a strong bullish momentum.
Here are key steps in identifying your high tight flag pattern.
1. Locate Your Strong Rally
The very first characteristic of any high tight flag pattern is the flagpole, which is a very sharp rally in a short period of time. A steady rise over time with constant reversals may not be considered a proper flagpole for the high, tight, flat pattern.
To help you determine the strength of the rally, you can place the volume indicator on your chart. What you want to see is a relatively high pressure on the flagpole.
2. Flag Depth, Tightness, and Duration
The flag of the high tight flag pattern must have specific characteristics. For instance, the depth of the flag should not last for too long, fall below 25% of the rally, and not be too wide.
As a matter of fact, you may see some inside day or inside bar candlestick patterns showing up. That’s a good sign. Also, overly wide flags are a “red flag.” The pattern is called the high TIGHT flag for a reason. For extra confirmation, the volume on the flag should also be lower compared to the volume on the flagpole.
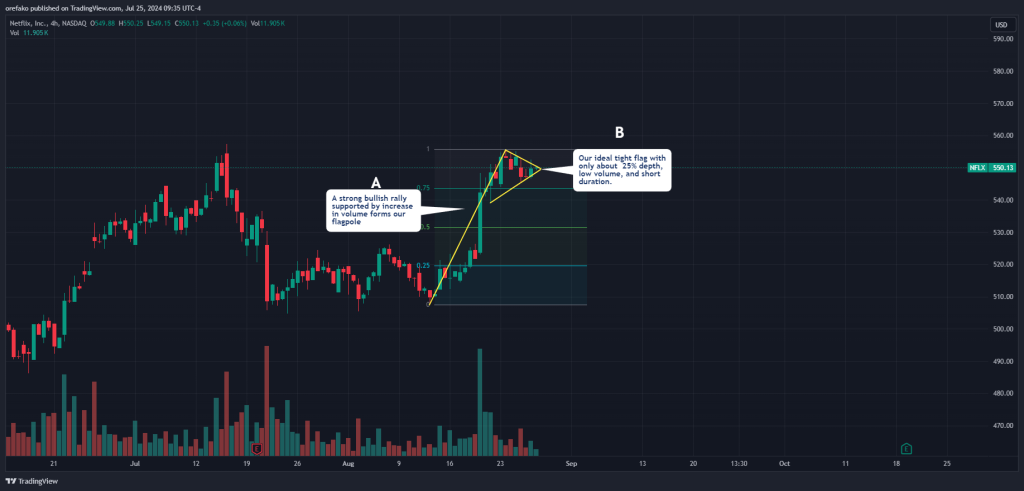
In the Netflix 4-hour chart above, for instance, notice how the price rallies with strong volume. Then our tight flag forms. Notice how this tight flag meets all of our criteria. This confirms to us that we have a potential high tight flag pattern in our hands.
3. Breakout
This is the characteristic that completes the high tight bull flag pattern. This is where the volume returns to the market, and you see an explosive breakout from the flag. Also, if there was already a false breakout during the formation of the flag, your clear breakout should rise higher than that as well.
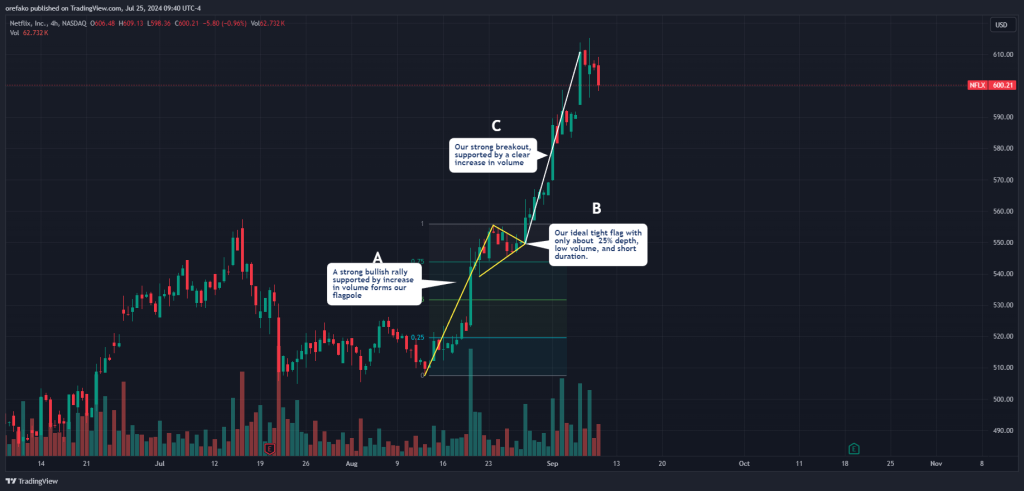
Continuing with our Netflix 4-hour chart above, notice that once the stock breaks above the upper level of the flagpole, a strong bullish uptrend continues. Also, observe that volume returns to the chart.
High Tight Flag Pattern Trading Strategy (In 4 Steps)
Now that you know how to identify the high tight flag pattern, let’s see how you can use it to find profitable trades.
At basic, with the high tight flag, you apply the breakout strategy. Once the price breaks through the upper line, we have a first signal that the price will continue upwards. However, you must first identify the pattern, find a consolidation phase, and add another technical analysis tool to confirm the breakout.
So let’s go step-by-step to show you how to trade with the high tight flag pattern.
Step 1: Identify an Uptrend
The first step in trading the high tight flag is properly identifying it. As the pattern is bullish, you have to look for it during an uptrend. For the high tight flag pattern, the price must rise at least 100% over the last 4-8 weeks. From there, you can draw a flag pole, which is a very useful trend line regardless of the high tight flag pattern.
The flag pole has to be diagonal, and you should draw it from the starting to the highest level of the last upswing.
Step 2: Wait for the Consolidation Phase
Once the first upward trend ends, you must wait for the price to retrace. Then, the price trends downward and may enter into a ranging market. In this area, you are looking for consolidation or just a pause in the upward trend. This is where the Wyckoff stage comes in, and all market participants accumulate the asset.
To identify the consolidation phase, you must find clear support and resistance levels and normally low trading volume combined with unexpected large transactions.
Step 3: Wait for the Price Breakout and Use a Moving Average Indicator to confirm the Breakout
After the consolidation phase, the price must break above the upper line. Once it breaks, the high tight flag pattern is valid, and you get a signal to enter a trade. For confirmation, you can use moving averages or any other trading tool like Fibonacci retracement levels.
In the example below, we used a basic moving average line as an extra tool to confirm the breakout.
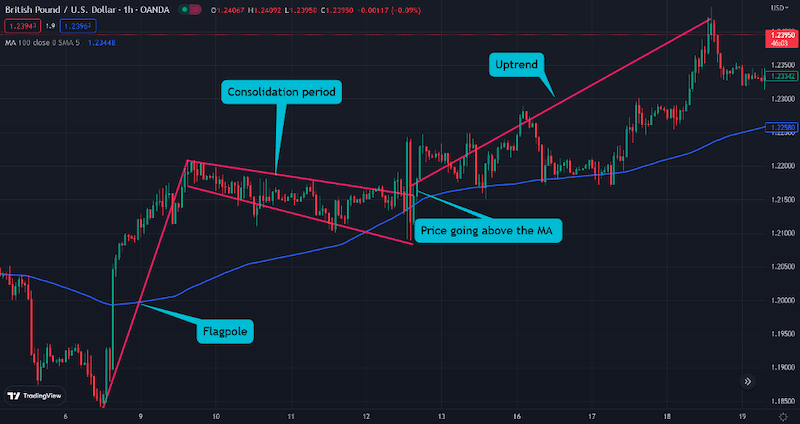
The chart above shows that when the price begins to break above the upper trend line, it also breaks above the 100 moving average trend line, confirming that the trend is likely to continue.
Step 4: Enter a Position, and Set Stop-Loss and Take-Profit
The last step is to enter a trade.
So, when trading the high tight flag candlestick pattern, you enter the trade once the price breaks above the upper line and get an extra confirmation from another indicator.
For stop-loss, you can set it at the lower line of the flag, meaning the SL order is very tight. As for take-profit, you can look at the previous high or use the 50% rule, at which you calculate the last upswing and use half of it to determine your exit level.
What are the Benefits and Limitations of the High Tight Flag Pattern
Although the high tight is a solid bullish pattern that may produce huge returns if used correctly, it also has drawbacks. So, let’s find out the pros and cons of trading with the high tight flag pattern.
Pros
- The pattern provides a clear entry point
- Typically, the high tight flag may produce big returns as the second upswing may be significant
- The pattern is very accurate and reliable
- The high tight flag enables investors to set tighter stop-losses
Cons
- The high tight flag chart pattern rarely occurs in the markets
- The pattern may not work on shorter timeframes
What’s the Difference Between a High-Tight Flag and a Bullish Rectangle Chart Pattern?
The high tight and the bullish rectangle patterns are both known as flag patterns. As the name suggests, the rectangle flag has a rectangular flag, and the price tends to rise modestly following the breakout. Also, the first upswing may be less rapid and significant.
On the other hand, in the high and tight flag pattern, the price stays in a tight range in its consolidation phase, and the first upswing must be massive, with an increase of at least 80% to 100%.
Key Takeaways
Now, let’s check the key takeaways from this article about the high tight flag pattern.
- The high tight flag chart pattern is a bullish continuation pattern
- The pattern starts with an initial uptrend, followed by a price retracement. Then, following the consolidation mode, a trend continuation signal is given once the price breaks above the upper line
- You can enter the trade when the price breaks above the upper line of the flag
- You can add other indicators or tools like the Moving Average and Fibonacci support and resistance levels to confirm the trend
- Stop loss is placed at the lowest price level of the flag. Take profit target could be placed at a 50% ratio of the first upswing trend
Frequently Asked Questions About the High Tight Flag Pattern
Here are the most frequently asked questions about the high tight flag pattern:
Is the high tight flag chart pattern bullish or bearish?
The high tight is a bullish chart pattern. It starts with an uptrend, retraces for a while, and then the price increases. Then, during the consolidation mode, you can identify the high tight flag pattern and join the existing bullish trend.
What does a high tight flag chart pattern indicate?
The high tight flag indicates a robust bullish momentum in the market. Based on the theory behind this pattern, big players enter the market during the accumulation (consolidation/correction) phase, eventually pushing prices much higher.
What are the key criteria for identifying a High Tight Flag pattern?
The general characteristics of the pattern are:
The pattern must appear in an uptrend of 100% or more in 4-8 weeks.
Following a strong upswing, a lengthy consolidation phase occurs. The pullback must be between 10%-25%.Once the price breaks through the upper channel, a bullish signal is made and you can enter the trade.
Risk Disclosure: The information provided in this article is not intended to give financial advice, recommend investments, guarantee profits, or shield you from losses. Our content is only for informational purposes and to help you understand the risks and complexity of these markets by providing objective analysis. Before trading, carefully consider your experience, financial goals, and risk tolerance. Trading involves significant potential for financial loss and isn't suitable for everyone.