Although exhaustion gaps are prevalent in all financial markets, they are most common in the stock market, especially if you trade the morning bell.
However, these gaps aren’t just voids in the market. They are keys to certain kinds of price movements on the chart. And knowing how to use these gaps can produce trading opportunities for day traders and swing traders.
- Like other types of gaps, the exhaustion gap is an area on a price where there’s no trading activity.
- It appears at the end of a trend and signals the end of a trend, hence, a price reversal.
- Trading exhaustion gaps can be highly profitable if well mastered.
In this article, we’ll show you what exhaustion gaps are and what they aren’t. We’ll also show you how to spot and trade them. Let’s dig in.
- What is an Exhaustion Gap in Trading
- What Makes the Exhaustion Gaps Important?
- How is the Exhaustion Gap Different from Other Types of Gaps?
- How to Identify An Exhaustion Gap on a Price Chart in 3 Steps
- The Exhaustion Gap Trading Strategy – How to Trade Exhaustion Gaps
- What are the Benefits of Trading Exhaustion Gaps
- What are the Limitations of Trading Exhaustion Gaps
- Key Takeaways
- Frequently Asked Questions
What is an Exhaustion Gap in Trading?
Exhaustion gaps are voids in the price of a financial instrument that happen at the end of a price trend just before a reversal. They are most common on daily charts and appear as spaces or blank areas between the closing price of a day’s candlestick and the opening price of the next day’s candlestick.
Like other types of gaps, the exhaustion gap is an area on a price where there’s no trading activity. It usually occurs between two days, although it can happen during the day when significant economic factors might drastically affect the asset’s price.
The idea behind exhaustion gaps is simple. As the name implies, an exhaustion gap is characterized by a shift in market momentum. Bullish exhaustion gaps happen because there is a sudden shortage of sellers in the market, having ridden the bearish trend for a while. Similarly, bearish exhaustion gaps occur because there aren’t enough buyers to continue the trend.
In both situations, you could say the buyers and the sellers are “exhausted.” And when they are, the opposing trend takes over with a reversal. So, a bullish exhaustion gap leads to a bullish reversal, while a bearish exhaustion gap leads to a bearish reversal.
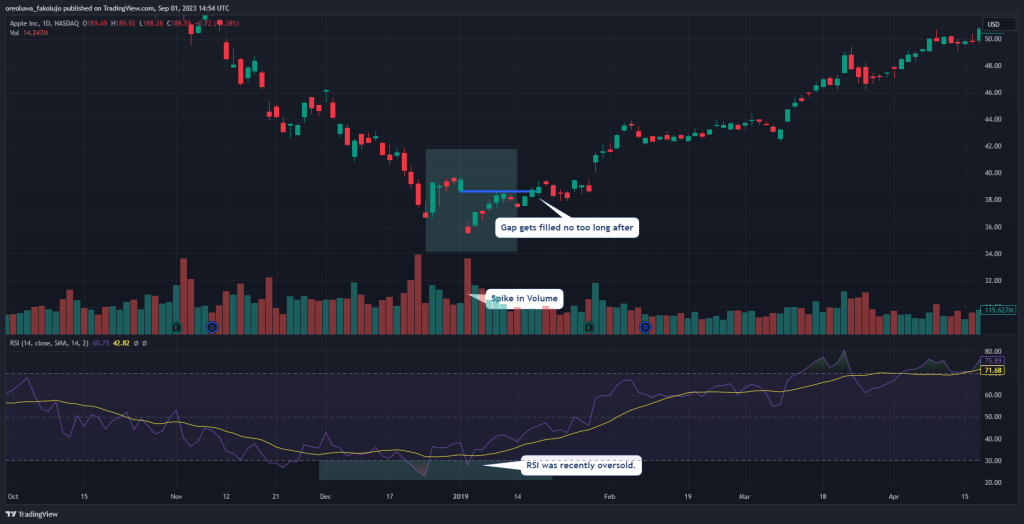
In the Apple daily chart below, you can see what an exhaustion gap looks like:
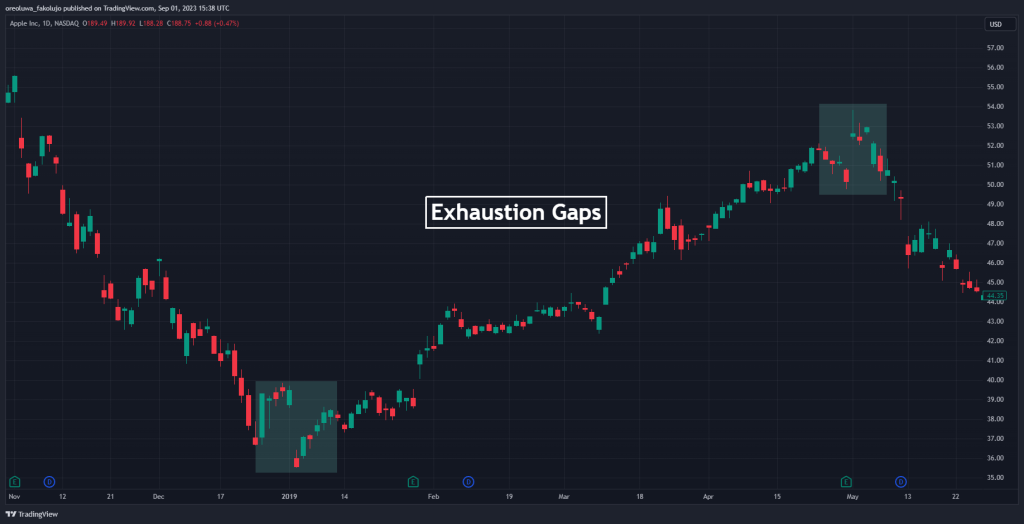
The rule of thumb is that the stronger the trend and the wider the Exhaustion Gap, the stronger the reversal. However, reversals that result from exhaustion gaps aren’t what you want to hold on to long term. Usually, they don’t even last as long as the trend that led up to them.
What Makes the Exhaustion Gaps Important?
Exhaustion gaps are important to price action traders because of the story they tell.
1. Potential Trend Reversal Signal
They can be a valuable indicator of a potential shift in the market’s direction. By identifying an exhaustion gap, a trader might anticipate a trend reversal and adjust their positions accordingly. Entering a short position after an exhaustion gap up (uptrend) or a long position after an exhaustion gap down (downtrend) could be profitable if the reversal materializes.
2. Identifying Exhaustion
Exhaustion gaps highlight the potential exhaustion of buying or selling pressure in a trend. This way, you can get a better understanding of market sentiment and the power interplay between the bulls and the bears.
3. Price Discovery
The gap itself represents a jump in price that wasn’t filled by trading activity during the previous session. This can signify significant news or events impacting the market sentiment. This little piece of information can come in handy for you as a trader in that it helps you to re-evaluate the asset’s value.
How is the Exhaustion Gap Different from Other Types of Gaps?
The Exhaustion gap is only one of many types of gaps in the financial markets. Other gap types are:
- Breakaway gaps
- Runaway gaps
- Common gaps
- Fair value gaps.
Here’s how the exhaustion gap differs from them:
Exhaustion Gap vs. Breakaway Gap
The breakaway gap usually happens when the price breaks out of a support or resistance level. It marks a sharp increase in momentum as the price breaks out of the support or resistance level.
The major difference between the Exhaustion Gap and the Breakaway Gap is the swift reversal after the Exhaustion Gap. The breakaway gap usually brings about a new trend after breaking out of its support or resistance level. The exhaustion gap, on the other hand, marks the death of a trend.
Exhaustion Gap vs. Runaway Gap
Another gap phenomenon that appears on price charts is the runaway gap. Unlike the Exhaustion Gap, a Runaway Gap represents a continuation of the current trend.
It happens when there’s a sudden increased buying interest in a bullish trend or when more sellers are jumping into a bearish trend. As a result, this forces the price to make a sharp movement in the direction of the trend, leaving a gap behind.
As you would expect of the runaway gap, it takes a long time for the price to return to it. However, the exhaustion gap takes little time to fill.
Exhaustion Gap vs. Common Gap
Common gaps form from simple price differences between an asset’s closing price and its opening price. Because they tend to appear frequently and are relatively small, there isn’t much to them.
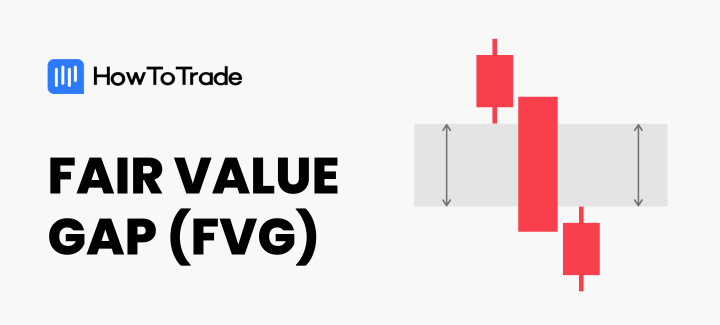
Exhaustion Gap vs. Fair Value Gap
Fair value gaps have become more popular among Inner Circle Traders (ICT). And unlike the other kinds of gaps, it actually isn’t a gap. Rather, it’s a three-candlestick formation where the tips of the first and third candlesticks don’t connect to the middle candlestick. But just like other kinds of gaps, this also tends to fill up, as it is seen as a form of imbalance on the chart.
There’s so much more to fair value gaps. Many modern professional traders have taken a liking to this concept because of how relatively reliable it has become if you know how to use it. We have a post covering everything you need to know about using fair value gaps. Check it out here:
The Comparison Between All Types of Gaps in Trading
This table shows how each gap compares to the other:
| Exhaustion Gap | Breakaway Gap | Runaway Gap | Common Gap | Fair Value Gap | |
| Timing | At the end of a trend | During a range or Area of indecision | Middle of a strong trend | Anywhere | Anywhere |
| Signal | Reversal | Breakout | Trend continuation | Inconclusive | Trend continuation or Reversal |
| Volume | Usually High | Varies from high to low | Usually High | Varies | Varies |
| Filling | Relatively quick | Relatively quick | Takes time | Varies | Varies |
How to Identify An Exhaustion Gap on a Price Chart in 3 Steps
Now that we’ve described the exhaustion gap, we will show you how to identify it on the charts. With practice, you will know how to spot and use it.
Three moves characterize exhaustion price gaps. And that is how you spot them.
Step 1: Identify A Strong Trend
By their nature, exhaustion price gaps happen at the end of trends to signal a reversal. So, the simple logic behind that nature is that the best place to spot them is in a trend. Therefore, you must first identify the trend when the exhaustion gap occurs.

The daily chart above shows the AAPL stock. Prior to the exhaustion gap, a strong bearish trend formed.
Step 2: Look for an Up-Gap or Down-Gap
This is where the gap comes in. In bullish trends, you’re looking for an Up-Gap. And in bearish trends, the gap down is what you look for.
A high volume also follows this gap-up or gap-down. The subsequent candlesticks often have relatively higher trading volumes compared to the volumes on the candlesticks just before the gap.
So, you’re looking for a thinning trading volume, followed by a gap accentuated by a high volume, and finally, relatively high subsequent volumes after the gap. As such, it is advisable to use volume indicators like the volume profile indicator, the volume price trend indicator, or the VWMA indicator.
Just for extra confirmation, pull up your RSI indicator. If the price was already overbought or oversold at any period around the gap, this suggests that the current trend is in trouble and a reversal is about to happen.

The image above is what all these would look like on a bearish trend.
Step 3: Wait for the Fill of the Gap
As mentioned, gaps are imbalances in the price action of an asset. Naturally, they tend to fill up. And by this, we mean that the price often retraces to the level of the opening price of the first candlestick. The filling of this gap is what identifies the exhaustion gap.
Some gaps may take long to fill, while others fill more quickly. While those that take longer to fill may still be exhaustion gaps, be weary of them, especially if the price action forms a new low or a new high without first filling the gap.
The chart above shows the filling of a bullish exhaustion gap pattern. Note that once the exhaustion gap is filled and the price moves higher or lower than the price level before the gap, a signal is given.
In the example above, when the price has filled the gap and continued moving higher, the reversal is confirmed, and you can enter a long-buying position with a stop loss at the lowest level of the previous swing.
NOTE: The three important steps in spotting an Exhaustion Gap are identifying the trend, the gap-up or gap-down, and the filling of the gap. The use of volume and RSI indicators is simply for extra confirmation. As such, you may not need to wait for all stars to align before the Exhaustion Gap forms. Sometimes, the RSI doesn’t confirm the Exhaustion Gap. Other times, the volumes after the gap don’t always noticeably supersede the volumes preceding the gap. These indicators are simply good signs to see in a perfect setup. However, perfect setups are few and far between on the charts.
The rule of thumb is that the stronger the trend and the wider the Exhaustion Gap, the stronger the reversal.
The Exhaustion Gap Trading Strategy – How to Trade Exhaustion Gaps
Beyond knowing what it is and how to use them, here’s how a simple exhaustion gap trading strategy:
Exhaustion Gap Trade Entry
Remember the three-step process of spotting your exhaustion price gaps? That’s the first step of the instructions.
The next thing you want to see is a retracement after the filling of the gap. This retracement, however, should not break the most recent swing low or swing high created by the gap. Otherwise, it is no longer an exhaustion gap because the trend is likely not yet done.
You may use the Fibonacci tool to trace your retracement. As always, the 0.618 and lower levels are usually great levels for trend reversals.
Once this retracement is over with the confirmation of a strong candlestick, place your trade.
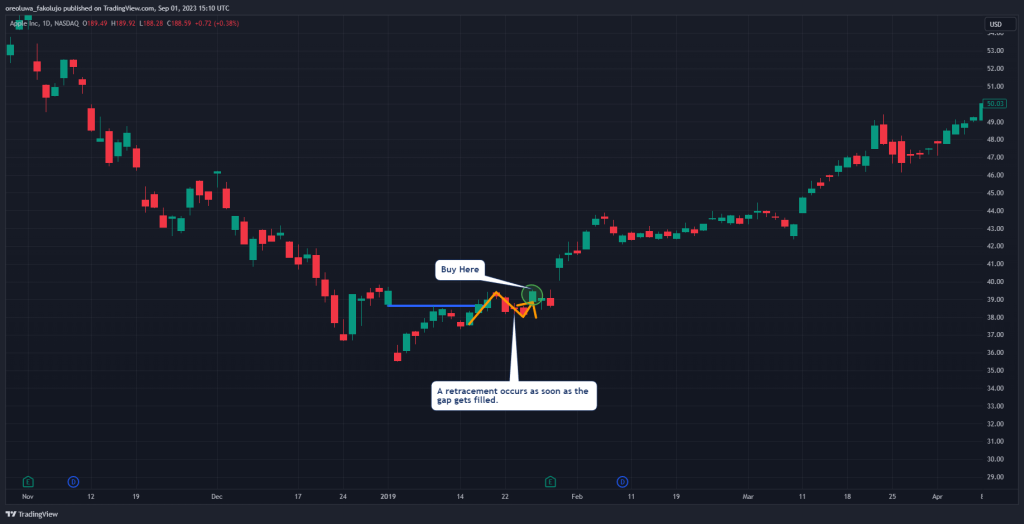
For instance, the image above is from the exhaustion gap we identified earlier. Although we didn’t show how we used the Fib tool on the chart, the retracement stopped just above the 0.236 level. Just how we love it.
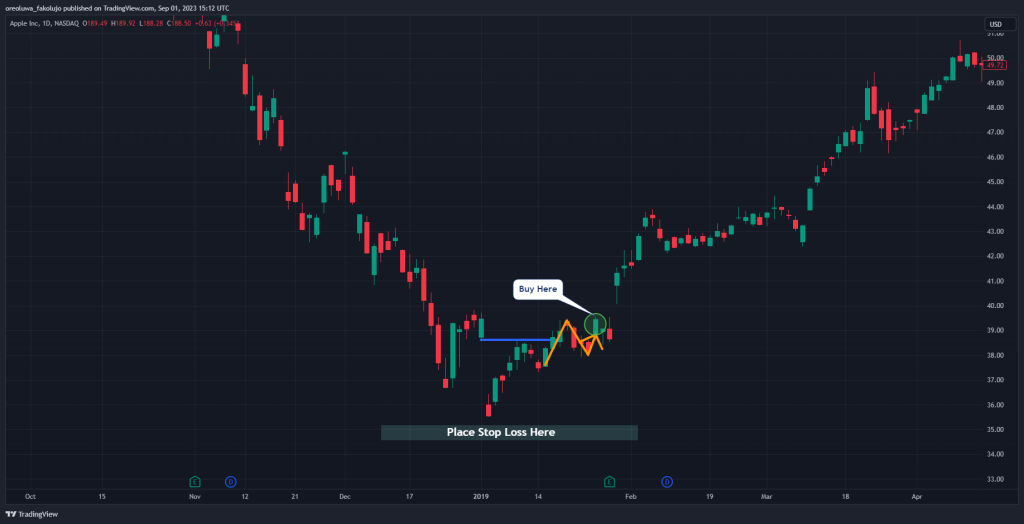
Setting Your Stop Loss
Next, you should place your stop loss just beneath the most recent swing low in a bullish exhaustion gap scenario and just above the most recent swing high in a bearish exhaustion gap scenario.
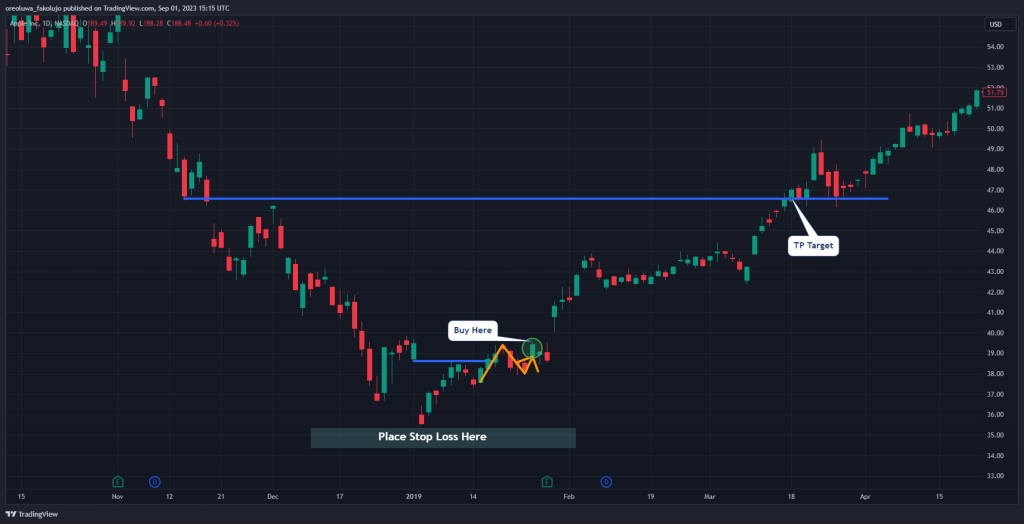
Setting Your Take Profit
Place your take-profit level at the first important area of support or resistance in the direction of your new trend. For instance, your TP in a bullish exhaustion gap would be at the first area of resistance. And your TP in a bearish exhaustion gap would be at the first area of support.
What are the Benefits of Trading Exhaustion Gaps?
Exhaustion gaps in trading offer several advantages for traders who can interpret them correctly and use them in their trading strategies:
1. Early Warning Signal
Exhaustion gaps can provide early indications that a trend may be losing momentum. This allows traders to prepare for a potential reversal or correction in price direction.
2. Confirmation of Trend Weakness
When combined with other technical indicators or price action patterns, exhaustion gaps can confirm that a trend is losing strength. This confirmation helps traders avoid entering late into a trend and potentially getting caught in a reversal.
3. Entry Points for Contrarian Traders
For traders specializing in contrarian strategies (buying near lows in downtrends or selling near highs in uptrends), exhaustion gaps can signal potential entry points. They offer a clear opportunity to enter trades in the opposite direction of the prevailing trend.
4. Risk Management
Exhaustion gaps often occur with decreased trading volume, indicating reduced interest or participation from market participants. This can be a signal for traders in that weakening trend to implement tighter risk management strategies, such as setting appropriate stop-loss levels or reducing position sizes.
What are the Limitations of Trading Exhaustion Gaps?
While exhaustion gaps can be valuable signals for traders, they also come with certain disadvantages and considerations that traders should be aware of:
1. False Signals
Not all exhaustion gaps lead to immediate reversals or significant price movements. Sometimes, what appears to be an exhaustion gap may turn out to be a temporary pause in the trend or a runaway gap rather than a true signal of exhaustion.
2. Timing Uncertainty
It can be challenging to determine the exact timing of a reversal after an exhaustion gap. Traders may experience waiting periods or uncertainty before seeing confirmation of a reversal or continuation.
3. Market Noise
In volatile or choppy markets, exhaustion gaps may occur more frequently but with less reliability. Market noise and random price movements can make it difficult to distinguish between genuine exhaustion gaps and false signals.
4. Lack of Confirmation
Relying solely on exhaustion gaps without confirmation from other technical indicators or price action patterns can increase the risk of entering trades prematurely. Traders should seek multiple confirming signals to validate the potential reversal.
5. Limited Application
Exhaustion gaps may not occur frequently in all markets or assets. Traders focusing on assets with low liquidity or specific trading hours may encounter fewer opportunities to utilize exhaustion gaps effectively.
Key Takeaways on Trading Exhaustion Gaps
Below, you will find the key takeaways from this article on exhaustion gap trading.
- The Exhaustion Gap is a price gap that appears towards the end of trends.
- The stronger the trend where the gap occurs, the stronger the reversal.
- Three things characterize the Exhaustion Gap: the trend, the gap in the direction of the trend, and the reversal or quick filling of the gap. You can also confirm it by a huge volume spike and the RSI indicator being in an overbought or oversold level.
- To confirm Exhaustion Gaps trade signals, you better use volume and momentum technical analysis indicators.
- To trade the Exhaustion Gap, enter a position when price action makes a retracement after filling the gap. Place your stop loss beneath the most recent swing high or low, and take your profits at the first important support or resistance area.
Frequently Asked Questions
Here are answers to some of the most frequently asked questions about exhaustion gaps.
Do Exhaustion Gaps get filled?
Yes. exhaustion price gaps do get filled most of the time. In fact, the quicker filling of this gap is what differentiates it from other kinds of gaps, like runaway gaps and breakaway gaps. Yet, there’s no guarantee that any type of price gap will always be filled. And, if it does, it might take days, weeks, and sometimes even years for a gap to be filled.
What usually happens after the Exhaustion Gap?
Trend reversals are what usually happens after Exhaustion price gaps. Exhaustion price gaps occur when a trend has run its course and the market momentum changes.
Why do gaps need to be filled in stocks?
Gaps don’t “need” to be filled in stocks. However, they often get filled. And this happens because gaps occur as overreactions in the first place. They are the results of emotions visible on charts, leading to imbalances on the chart. And because the price always seeks to cancel out imbalances, these gaps get filled. Also, note that there are other variations of price gaps, like the Fair Value gap, that are confirmed by a liquidity void, although there’s no blank space on a price chart.
Risk Disclosure: The information provided in this article is not intended to give financial advice, recommend investments, guarantee profits, or shield you from losses. Our content is only for informational purposes and to help you understand the risks and complexity of these markets by providing objective analysis. Before trading, carefully consider your experience, financial goals, and risk tolerance. Trading involves significant potential for financial loss and isn't suitable for everyone.