The triple top pattern is a bearish reversal pattern that occurs at the end of an uptrend and consists of three consecutive tops along with the same resistance level.
Here, in this article, we’ll show you how to trade triple top patterns, including some useful tips, and more.
What is the Triple Top Pattern?
As the name suggests, a triple top is a bearish technical analysis chart pattern that occurs after an uptrend and tests the highest price three times before it starts a bearish downward movement. After the price hits the third peak and falls below the neckline, the asset’s price is expected to continue falling and a trend reversal occurs.
Much like other reversal chart patterns, the triple tops pattern is used to predict the end of the previous trend and helps traders find good entry points.
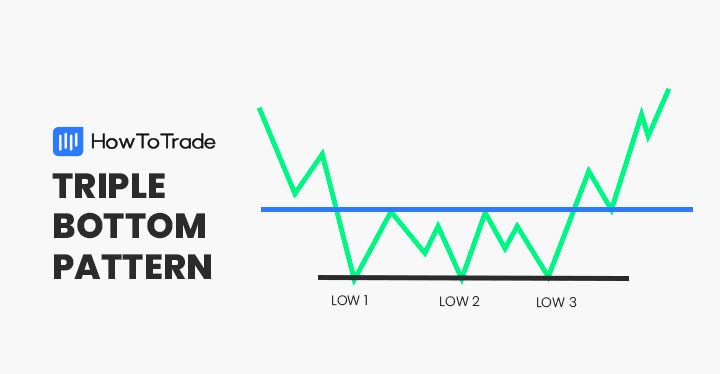
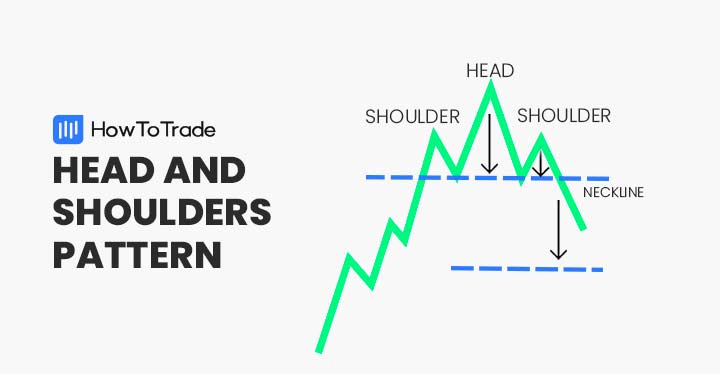
In terms of structure and characteristics, triple top chart patterns are made of the first, second, and third peaks at the same level and a neckline that serves as a support level. It is similar to the double top pattern as well as the head and shoulders pattern. The head and shoulders pattern is only different in the the head rises above the two shoulders.
How to Identify and Use the Triple Top Pattern?
A triple top pattern occurs when an asset reaches a certain resistance level and cannot move above it.
When this happens twice, the chart pattern is known as the double top pattern, but when the price tests the highest level three consecutive times, the pattern is known as a triple top pattern and it provides a stronger trend reversal indicator than the double top pattern.
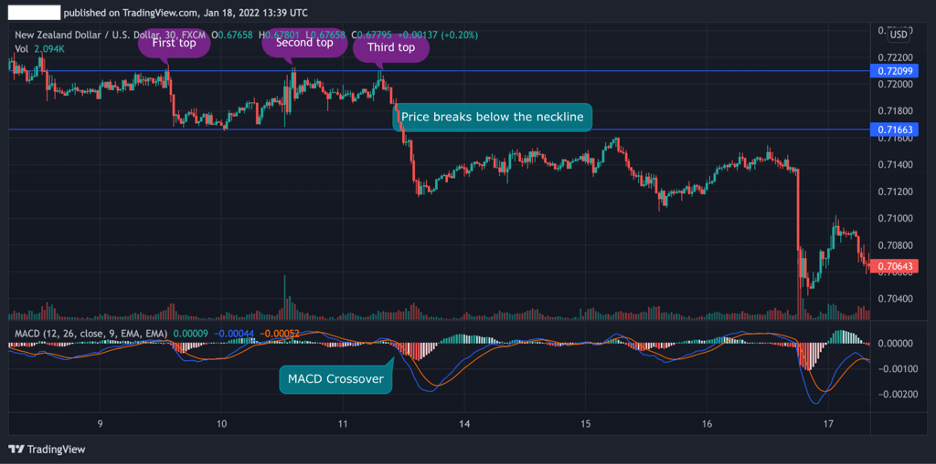
Here’s how a triple top pattern works on a trading chart:

As you can see in the NZD/USD 30 minute chart above, the price stops at the resistance level three times and then falls below the neckline. This is how the triple top chart pattern works. As we said before, it is a fairly simple chart pattern, especially when compared to other advanced patterns.
So, in a nutshell – to identify, use and trade triple top chart patterns, follow these 5 steps below.
- Identify three tops at a resistance line that appear after a bullish trend
- Draw a support line around the lows of all price swings
- Wait until the price breaks below the support neckline
- Draw Fibonacci retracement levels or add the MACD indicator
- Enter a short position with a stop loss at or slightly above the neckline
How to Trade the Triple Top Candlestick Pattern?
In essence, using a triple top pattern is straightforward and the rules are simple to follow. Whenever you find a chart pattern with three tops and a break below the neckline, a short sell trade should be made.
However, to increase the chances of success, it is important to confirm the pattern with other technical indicators and develop an effective trading strategy. For that purpose, we have decided to show you two examples – the triple top pattern combined with Fibonacci levels and the MACD (Moving Average Convergence Divergence).
1. Moving Average Convergence Divergence (MACD) and Triple Top Pattern
The MACD is a technical analysis indicator primarily used to identify trend reversals. Normally, in all trading platforms including the popular MT4, you’ll be able to add this indicator and get another confirmation for a change in momentum.
For this demonstration, we use the same chart from the above example but this time, we added the MACD indicator as another tool to confirm that the breakout below the neckline is not a false breakout. As you can see, the MACD crossover occurs exactly at the time the price breaks the neckline, which helps to confirm the trend reversal.
2. Fibonacci Retracement Levels and Triple Top Chart Patterns
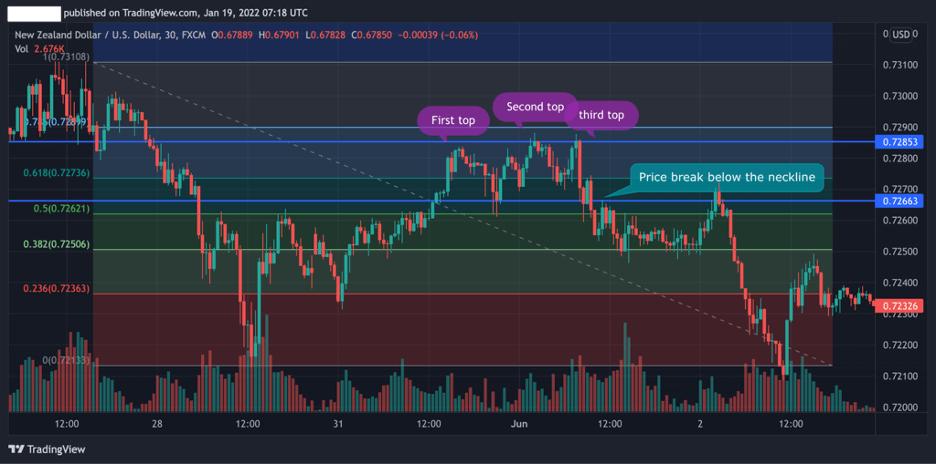
Another great way to confirm a trend reversal when using the this bearish candlestick pattern is to draw Fibonacci retracement levels. From the example below you can see how the 50% Fibonacci retracement level can be used as another confirmation tool to enter a trade after the breakout.
Further, in this case, a trader can place the stop-loss order at a Fibonacci level above the neckline and ensure the stop loss will not be triggered too early.
In our example, the 50% Fibonacci level could be a good entry level with a stop-loss order at the 61.8% Fibonacci level.
Finally, when the price breaks the neckline and falls again after the retest of the 61.8% Fibonacci level, the start of the bearish trend is confirmed and the price target should be set at one of the Fibonacci levels (or below using Fibonacci extension levels).
For both triple top trading strategy combinations, don’t forget to use proper risk management. Place your stop losses slightly above the neckline of the candlestick formation.
The Triple Top Pattern – Pros and Cons
These are the most common pros and cons of trading the triple top pattern:
Pros
- Easy to identify
- Among the most accurate and reliable trend reversal patterns
- A great method to identify trend reversals
Cons
- Not occurs very often
- Stop-loss can be triggered when the price pulls back (Fibonacci levels can be used to solve this problem)
Everything About the Triple Top Pattern in One Video
Watch our video for more information on how to identify and trade the triple top pattern.
Key Takeaways
In conclusion, here are the key takeaways:
- The triple top pattern is a bearish trend reversal pattern that is made of three peaks and is confirmed by a price break below the neckline
- Other technical analysis tools can be combined with the triple top pattern including Fibonacci retracement levels and moving average convergence divergence
- When trading the triple top pattern, a stop-loss should be placed slightly above the resistance neckline
Risk Disclosure: The information provided in this article is not intended to give financial advice, recommend investments, guarantee profits, or shield you from losses. Our content is only for informational purposes and to help you understand the risks and complexity of these markets by providing objective analysis. Before trading, carefully consider your experience, financial goals, and risk tolerance. Trading involves significant potential for financial loss and isn't suitable for everyone.