Are you interested in chart patterns? Confused by exotic terms such as “bull flag” and “bear flag?” There’s no need to worry —with a bit of study, you can learn how to trade flag patterns!
The bear flag pattern is a continuation pattern. It signals the extension of a prevailing downtrend after a temporary pause in price action has been completed. Read on to learn more about the bear flag and how to integrate it into your trading strategy.
What is the Bear Flag Pattern?
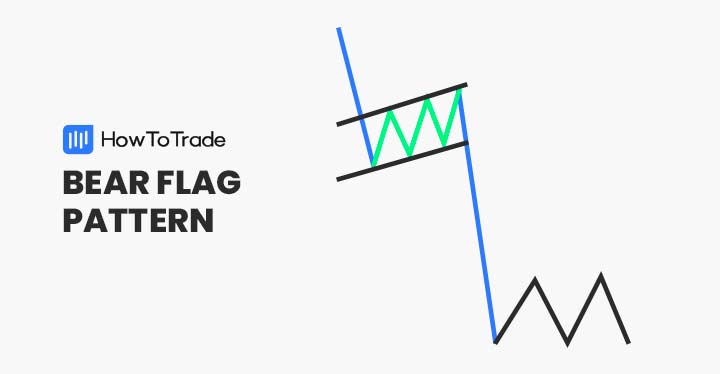
The bear flag pattern is a price chart formation that suggests a further extension of a prevailing downtrend. Bear flags consist of two parts: the flag pole and the flag.
The flag pole is a pronounced downward price movement, while the flag is a period of sideways price action. The bear flag pattern is the opposite of the bull flag pattern and is incorporated into short-side trading strategies.
Like all flag patterns, traders interpret the bear flag as a signal of trend continuation. Subsequently, the formation is commonly used to sell FX currency pairs. By doing so, savvy traders can profit from bearish price breaks.
How do You Identify and Use the Bear Flag Pattern?
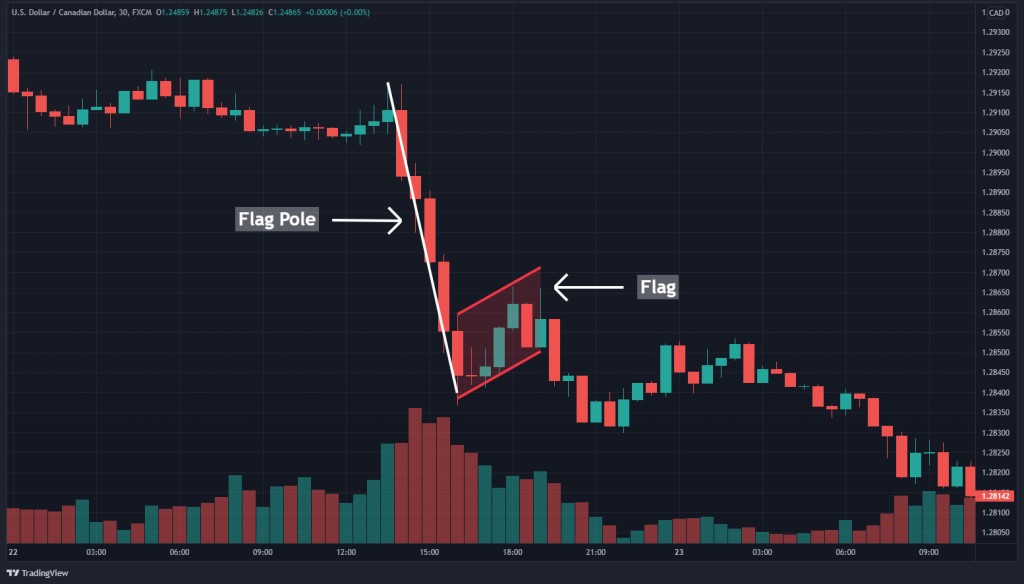
The bear flag is a signal of market consolidation that occurs within a downtrend. Visually, it appears as a sharp bearish price break, followed by a period of horizontal or “sideways” price action. As you can see in the USD/CAD chart below, both the flag pole and flag are apparent.
Identifying the bear flag pattern in real-time is a straightforward process. Follow the steps below to spot bear flags on your price charts.
- Identify a sudden, bearish move in price action.
- Draw a bearish trendline. This line is the flag pole.
- Identify a period of sideways price action.
- Draw a line on the upper and lower extremes. The trading range inside these lines is the flag.
What’s the Difference Between the Bear Flag and Bull Flag Patterns?
It’s essential to understand the difference between the bullish flag pattern and the bearish flag pattern. Although each is a technical analysis continuation pattern, trend direction is everything.
- A bearish flag develops during a downtrend
- A bullish flag pattern develops during an uptrend
As a result, the bearish flag pattern resembles the capital letter “L.” On the other hand, the bullish flag pattern looks more like a “P.” Also, traders attempt to profit from a rising price action with the bull flag. For a bear flag, falling price action is desirable.
How do You Trade the Bear Flag Pattern?
One of the best things about the bear flag chart pattern is that it is easy to trade. All you need to do is identify the trend (flag pole), draw the flag, and place your profit target and stop-loss orders. After doing so, trade execution and management become a breeze.
Step 1: Identify the trend
The first step in trading the bear flag formation is identifying a solid downtrend. The multiple timeframe analysis below can help you quickly do so:
- Look for a downward move in pricing on charts with larger timeframes. Weekly and daily charts are helpful in finding significant trends.
- Move to shorter, intraday charts to examine current price action. The 4-hour, 1-hour, and 30-minute charts are examples of useful periods.
If your chosen FX currency pair is trending south, multi-timeframe analysis can help to quickly spot the flag pole of the bear flag chart formation.
Step 2: Define the flag
Second, one must define the flag portion of the bear flag pattern. This is done via the following steps:
- Identify a period of consolidating price action immediately after the flagpole. Visually, price moves “sideways” in a confined range.
- Draw an upper trend line to define the upper bounds of the flag.
- Draw a lower trend line to define the lower bounds of the flag.
Remember, the flag chart pattern rarely resembles a perfect channel or square. It’s an approximation and basis for setting up a short trade.
Step 3: Sell rules
Finally, it’s time to place the trade. The bear flag formation is a short-side continuation pattern that works well as a sell signal. Below is a basic bear flag trading strategy:
- Place a sell order beneath the lower trend line of the flag. This order serves as the market entry point.
- Place a stop order above the flag’s upper trend line. This will serve as the stop-loss order.
- Align your profit target according to an acceptable risk vs. reward ratio. A few common ratios used by traders are 1:1, 1:2, 1:3, or 1:4.
Trading Example
To illustrate a real-world bear flag pattern trade, check out the USD/CAD chart below. Following a swift move to the downside in the 30-minute timeframe, exchange rates continued to fall.
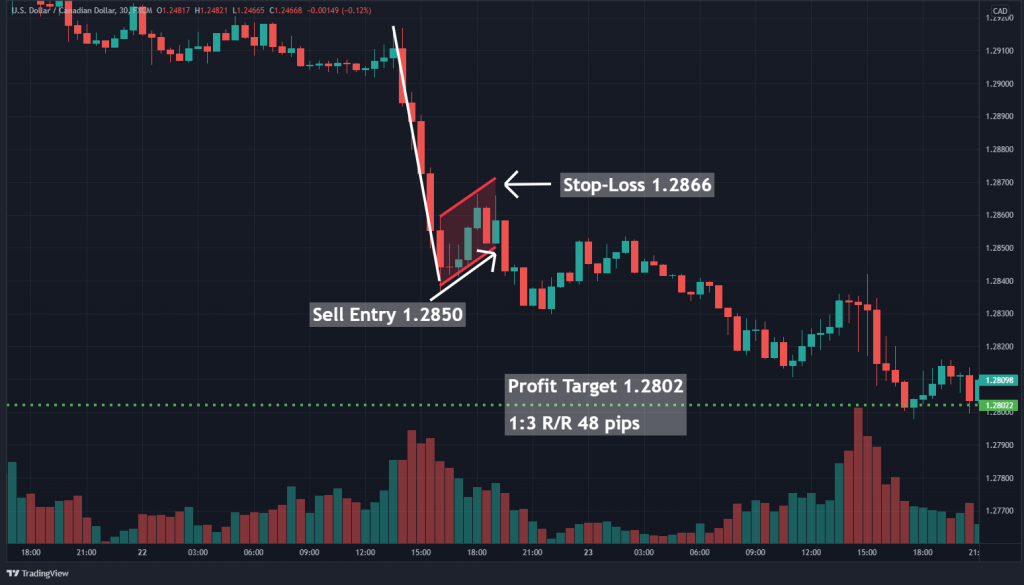
The trade above was executed as follows:
- The market was entered at 1.2850, beneath the flag.
- Stop-loss was placed at 1.2866, above the flag.
- A risk-reward ratio of 1:3 was implemented.
- The trade hit its profit target at 1.2802 for 48 pips.
What are the Bear Flag Pattern Pros and Cons?
As with all trading strategies and indicators, bear flag formations have a unique collection of pros and cons. Ultimately, it’s up to each trader to decide if bear flags are suitable for use in the market.
Pros
- Easy to identify
- One of the most reliable continuation patterns
- Occurs frequently
Cons
- Can produce false signals
- Large flags pose a significant risk
- Not as reliable on shorter time frames
Everything About the Bear Flag Pattern in One Video
You can check this video by our trading analysts on how to identify and trade the bear flag pattern with real-time examples.
Key Takeaways
To sum up, here are the key points to keep in mind about the bear flag pattern:
- The bearish flag pattern suggests downtrend extension. It is considered a bearish continuation pattern.
- A bearish flag consists of the flag pole and the flag. The flag pole is a pronounced downward movement in price. The flag is a period of sideways price action immediately after the flag pole.
- The bear flag chart pattern is conducive to a sell-side trading strategy.
- Bear flags are ideal for trading downtrends. To do so, a sell order is placed beneath the flag and a stop-loss order above the flag.
- The chart pattern can produce false signals and has a reduced efficacy on shorter timeframes.
Risk Disclosure: The information provided in this article is not intended to give financial advice, recommend investments, guarantee profits, or shield you from losses. Our content is only for informational purposes and to help you understand the risks and complexity of these markets by providing objective analysis. Before trading, carefully consider your experience, financial goals, and risk tolerance. Trading involves significant potential for financial loss and isn't suitable for everyone.