


The double bottom pattern is a bullish reversal chart pattern that occurs at the end of a downtrend and signals a possible trend reversal.
But how to identify and trade the double bottom pattern in financial markets trading? And what are the key factors to consider when using this pattern? All the answers are in the article below.
What is the Double Bottom Pattern?
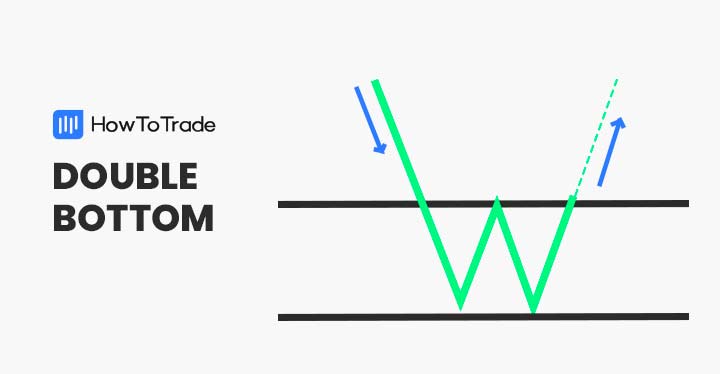
The double bottom pattern is a type of trend reversal pattern found on bar and Japanese candlestick charts. Much like its identical twin, the double top pattern, the double bottom pattern has two near-equal bottom levels near the same support line before the price bounces back and starts the next bullish uptrend. The highest point between both bottom levels is called the neckline.
Being a bullish reversal pattern, the double bottom formation is commonly seen when a downtrend is over and confirmed by two last attempts to break the support level. It is considered a momentum bullish reversal pattern and is primarily used by many traders to enter long buying positions.
How to Identify and Use the Double Bottom Pattern?
In general, it is fairly simple to identify a double bottom pattern on a trading chart. This pattern can be identified when the price retests the support line and rises up again above the neckline. As a tip, you can usually identify the pattern as a “W” letter formation.
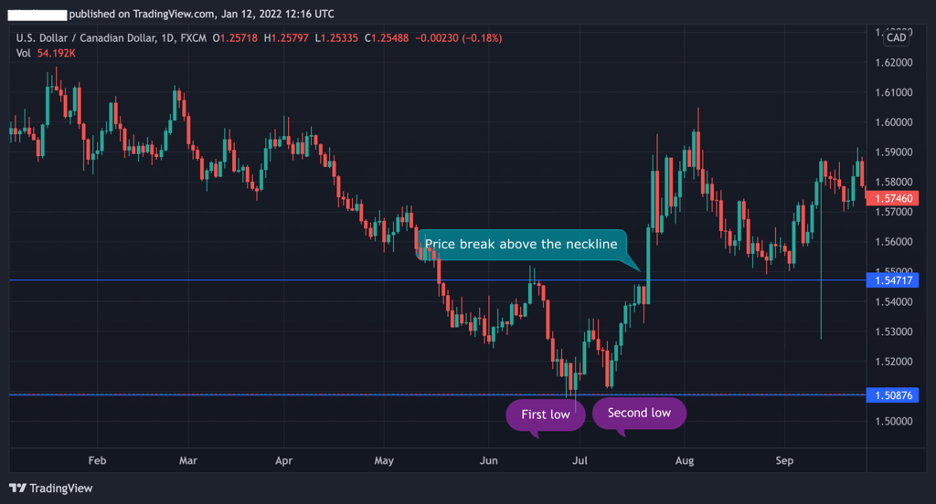
As you can see in the USD/CAD daily chart below, the pair has first and second lows and a neckline. Once it breaks above the neckline, the forex pair continues to trade higher and a bullish trend has started.

Below, we have outlined the steps that you need to follow in order to identify and trade the double bottom chart pattern in the market:
- Find a retest of the first bottom and draw a support line at the first and second bottom price levels
- Try to identify the first and second tops and draw the neckline around these levels
- Wait until the first candle is completed after the price breaks above the neckline
- Enter a long buying position with a tight stop-loss order at or below the neckline
How to Trade the Double Bottom Pattern?
As with many other chart patterns and technical indicators, there are many ways in which the double bottom pattern is formed on a price chart. You can find this pattern in a trending market when a long downtrend comes to an end or in a ranging market where the price consolidates and fails to break below the support line.
However, in all of the cases, when traders identify a double bottom formation, they wait for the asset’s price to break above the neckline and only then take a long position. To help you see how double bottoms look in reality, we are going to show you two examples.
Example 1: Double Bottom Chart Pattern at the End of a Downtrend
The double bottom chart pattern is certainly most effective when it appears at the end of a downtrend. When this happens, the price can potentially reverse and move up higher. In the example below, we can see a clear W formation at the end of a bearish trend.
As soon as the pair breaks above the neckline, the USD/CAD moves up higher and the momentum has shifted.
Example 2: Double Bottom Chart Pattern in a Ranging Market
Although the double bottom pattern is usually observed at the end of a downtrend, it can also be identified in a ranging market. As shown in the chart below, the price has first and second lows and a neckline, but this time, in a ranging market mode.
Then, once the price rises above the neckline, a shift in momentum occurs and the market sentiment turns bullish.

* Keep in mind that two bottom chart patterns are not always illustrated perfectly (as you can see in the example above) but the general idea is two bottoms near a support line and a clear neckline.
The Double Bottom Pattern – Pros and Cons
Here are the most common pros and cons of the double bottom chart pattern:
Pros
- Usually, if the price breaks above the neckline, there’s a high probability that the next bullish trend will be long and sustainable
- Can be seen in multiple chart time frames
- Can be identified in trending and ranging markets
Cons
- In some cases, the double bottom formation can become a triple bottom pattern and the stop loss will be triggered. That’s why some traders place their stop loss some ways below the bottom. However, the placement of your stop loss depends on your risk tolerance
- Usually, this trading strategy is more suited for day traders rather than long term investors
Everything About the Double Bottom Pattern in One Video
You can check this video by our trading analysts on how to identify and trade the double bottom pattern.
Key Takeaways
In conclusion, here are the key takeaways:
- The double bottom pattern is a bearish momentum reversal that looks like the letter W
- To identify the double bottom formation, you need to see three main elements: a low with a previous low before it, and a clear neckline.
- The double bottom formation is more effective at the end of a strong downtrend rather than in a ranging market
- To trade this pattern, you need to draw a support level and a neckline
- It is important to confirm that pattern with other technical analysis tools – Moving averages, RSI, Fibonacci retracement level, and MACD
- The best way to trade the double bottom pattern is to wait until the price breaks the neckline with a stop-loss order and a risk-reward ratio
Frequently Asked Questions (FAQs)
Here are some of the most frequently asked questions about the double bottom chart pattern:
How do you trade a double bottom pattern?
The double bottom pattern is a bullish trend reversal pattern that occurs when two low levels are forming near a support horizontal level. As such, when you identify the pattern and the price rises above the neckline, then you buy the asset. However, we recommend you use this tool with other technical indicators or trading tools.
What does a double bottom pattern indicate?
Basically, a double bottom pattern indicates that sellers can no longer push prices down. In this case, the asset’s price can’t break below a certain level and a bullish trend reversal is likely to occur.
Can a double bottom appear during an uptrend?
Yes, in some cases you can find a double bottom pattern during a bullish trend. This represents a failing attempt to change price direction and thus, the bullish trend is expected to continue.
Related Chart Patterns to the Double Bottom Pattern
As previously mentioned, there are some chart patterns that resemble the double bottom formation. Here are some of those:
Risk Disclosure: The information provided in this article is not intended to give financial advice, recommend investments, guarantee profits, or shield you from losses. Our content is only for informational purposes and to help you understand the risks and complexity of these markets by providing objective analysis. Before trading, carefully consider your experience, financial goals, and risk tolerance. Trading involves significant potential for financial loss and isn't suitable for everyone.


