The bullish rectangle is a continuation chart pattern that occurs during an uptrend and indicates that the existing trend will continue. The pattern is reasonably more straightforward to identify than other patterns and provides a reliable signal to join a market trend.
This article will show how to identify and trade bullish rectangles.
What is the Bullish Rectangle Candlestick Pattern?
A bullish rectangle is a continuation chart pattern that occurs during an uptrend when prices pause before moving upward. It is a chart formation developed when the price moves sideways, and there’s a temporary equilibrium before the next price movement.
Once the price breakout occurs above the upper resistance level, the pattern is valid, and a buy signal is given.
Generally, rectangle patterns are part of the classical chart patterns group and they show a temporary period of indecision between buyers and sellers. These are very common and powerful chart patterns that involve the breakout trading technique.
The opposite version of the bullish rectangle pattern is the bearish rectangle pattern with the same formation and set of rules and occurs during a bearish trending market.
How to Identify and Use the Bullish Rectangle Pattern in Trading?
To identify the bullish rectangle trading pattern, you need to find a trending currency pair that is entering a consolidation price mode. Then, you need to draw support and resistance trend lines at the top and bottom of the price range. If the price breaks above the resistance line, then the bullish rectangle pattern is confirmed, and a buying signal is given.
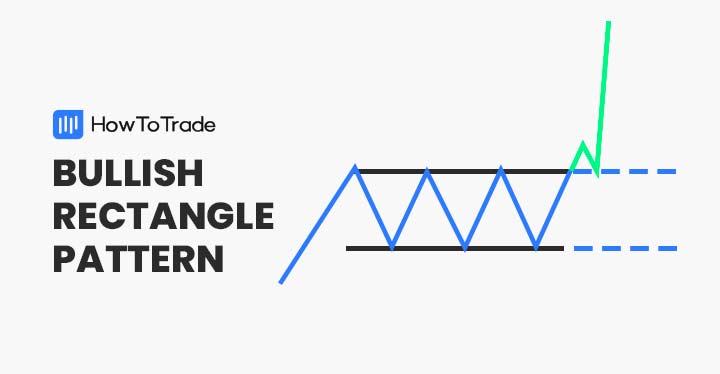
In the below example, you can see the bullish rectangle formation on a price chart.

Following the first uptrend, the price pauses and enters a consolidation mode with two bottoms and two tops. Then, as soon as the price breaks above the upper parallel line of the temporary price range, the previous bullish trend continues.
So, with that in mind, here are the steps you need to follow to trade the bullish rectangle candlestick pattern correctly.
- Identify a price consolidation mode after a bullish uptrend
- Draw support and resistance lines at the top and bottom of the price range
- Wait for the price to break above the resistance line and enter a long position
- Set your stop loss below the support line and use Fibonacci retracement levels to identify profit targets
How to Trade the Bullish Rectangle Candlestick Pattern?
Generally, trading the bullish rectangle pattern is reasonably straightforward. It is not a complicated chart pattern like harmonic patterns, and it does not require the integration of other technical indicators.
In essence, when trading the bullish rectangle pattern, you will implement the breakout trading strategy. With this strategy, a trader looks for levels where an asset has been unable to break above or below certain price levels. When the asset’s price finally breaks above the support or resistance levels, it is known as a breakout.
In the section below, we take a step-by-step approach to ensure you understand how to trade the bullish rectangle chart pattern:
Step 1: Identify a Trending Market
Even before you recognize a range-bound market, you first need to identify an asset in a bullish trending mode. This is because the bullish rectangle is a continuation chart pattern and signals the continuance of the prior trend.
Step 2: Identify Price Consolidation and Draw Support and Resistance Levels
The next step is to spot a market that is experiencing a price consolidation period. If you have identified at least two tops and two bottoms, then you can draw support and resistance levels, and that’s it; you have a bullish rectangle pattern.
From this point forward, the rest is in the hands of the market. If the price breaks above the higher parallel line, the pattern is confirmed, and you join the bullish trend. Otherwise, you switch sides and short-sell the asset.

Step 3: Wait for the Breakout and Use Fibonacci Retracement levels to Confirm It
Now you are waiting for the breakout to occur. However, to avoid false breakouts, you want to confirm the breakout with other tools like Fibonacci levels. So, all you have to do to use the Fibonacci Retracement tool is look for the primary prior trend and stretch the Fibonacci tool from the lowest to the highest level.

Step 4: Enter a Position and Set Stop Loss and Take Profit Orders
Finally, you can enter a buy trade when the price breaks above the resistance line. For that matter, some traders enter a trade immediately when the breakout occurs while others might prefer confirming it with other tools to ensure the trend continues.
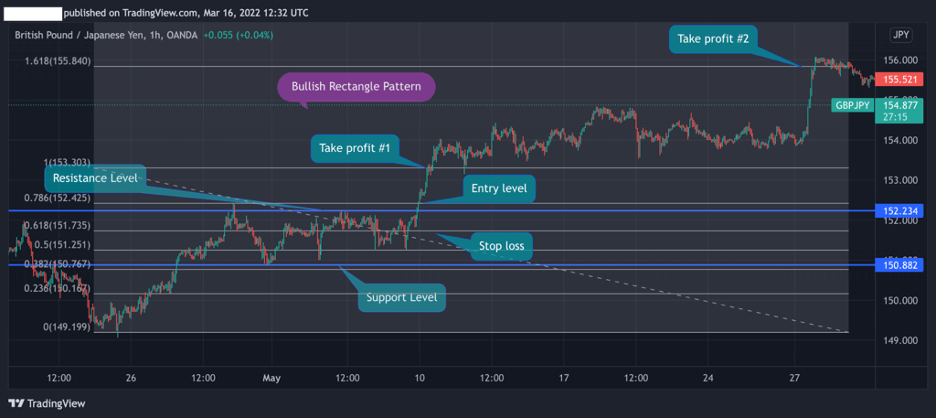
The chart below shows the ideal entry level at the 78.6% Fibonacci level. Stop loss could be placed at the resistance level or below the 50% Fibonacci level. Take profit target is placed at the 100% Fib level or the 161.8% extension level.
The Bullish Rectangle Pattern – Pros and Cons
These are the most common pros and cons of trading the bullish rectangle pattern:
Pros
- The bullish rectangle pattern is easy to identify and trade
- Traders can trade the bullish rectangle pattern without any additional tools
- Entry point, stop loss, and take profit are easy to recognize
Cons
- False breakouts may occur
Key Takeaways
Here are the key takeaways from our bullish rectangle chart patterns guide:
- The bullish rectangle pattern, also known as the bullish channel pattern, is a continuation technical analysis chart formation that occurs during a bullish trend when the market is experiencing a consolidation mode
- The pattern consists of two parallel lines with two bottoms and two tops, creating a sideways market during a trend
- After identifying the bullish rectangle pattern, a trader enters a buy position when the price breaks above the resistance line
- Stop-loss is placed below the resistance level, and take profit is placed at one of the following Fibonacci levels
Frequently Asked Questions (FAQs)
Here are some of the most frequently asked questions about the bullish rectangle pattern in forex:
How to trade the bullish rectangle chart pattern?
Simply put, trading the bullish rectangle pattern means you are looking for the breakout beyond the resistance level. To ensure the trade is going in your direction, you can use the Fibonacci tool and enter a position when the price rises above the relevant Fibonacci level. Further, you need to set a stop-loss order below the resistance level.
What does a bullish rectangle pattern mean?
A bullish rectangle formation indicates that the price pauses before it trades in the same direction as the previous trend. As a continuation chart pattern, it signals that the battle between buyers and sellers is over and the market is expected to continue to trade higher.
What is a bearish rectangle pattern?
A bearish rectangle pattern is the same as the bullish rectangle that occurs when the price pauses during a bearish trend and temporarily enters a consolidation mode between two parallel levels before prices continue to fall.
Risk Disclosure: The information provided in this article is not intended to give financial advice, recommend investments, guarantee profits, or shield you from losses. Our content is only for informational purposes and to help you understand the risks and complexity of these markets by providing objective analysis. Before trading, carefully consider your experience, financial goals, and risk tolerance. Trading involves significant potential for financial loss and isn't suitable for everyone.