What are Trend Lines in Forex?
Trend lines stand out as crucial instruments for technical analysts. These traders focus less on fundamentals like historical business performance or market news and more on identifying market trends. One of the many ways they achieve this is by skillfully drawing trend lines on price charts.
Indeed, when it comes to uncovering trends, trendline trading is unparalleled.
You might wonder, “Why is trend identification so critical?” Let’s dive into that.
Technical analysts believe that identifying the trend is the first step in better understanding market sentiment and making a good trade. But more on that later.
What is Trendline in Forex Trading?
A trend line is a straight, slanting line that connects at least two points and extends into the future to act as a line of support or resistance. In an upward trend, trend lines join key low points (called swing lows), while in a downward trend, they connect major high points (or a swing high), thereby forming what’s known as dynamic resistance.
On that matter, dynamic resistance means that as time changes, so do the prices of the support or resistance. For example, in an uptrend, the level of support goes up as time progresses. In a downtrend, the level of resistance goes down as time progresses. This way, we can get a visual representation of the market trend.
What Are Uptrend and Downtrend?
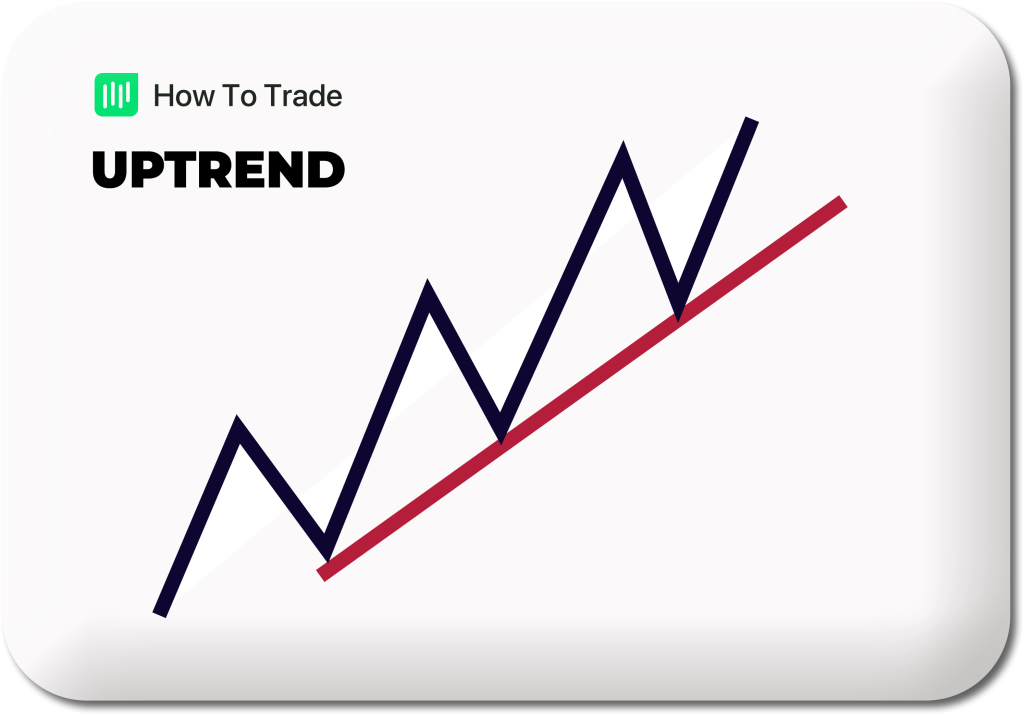
An uptrend line, characterized by a positive slope, links two or more low points. The line’s positive slope is confirmed when the second low is higher than the first. These bullish trendlines signal that market prices of an asset in the financial markets are rising and are expected to continue rising as long as we have a valid trendline.
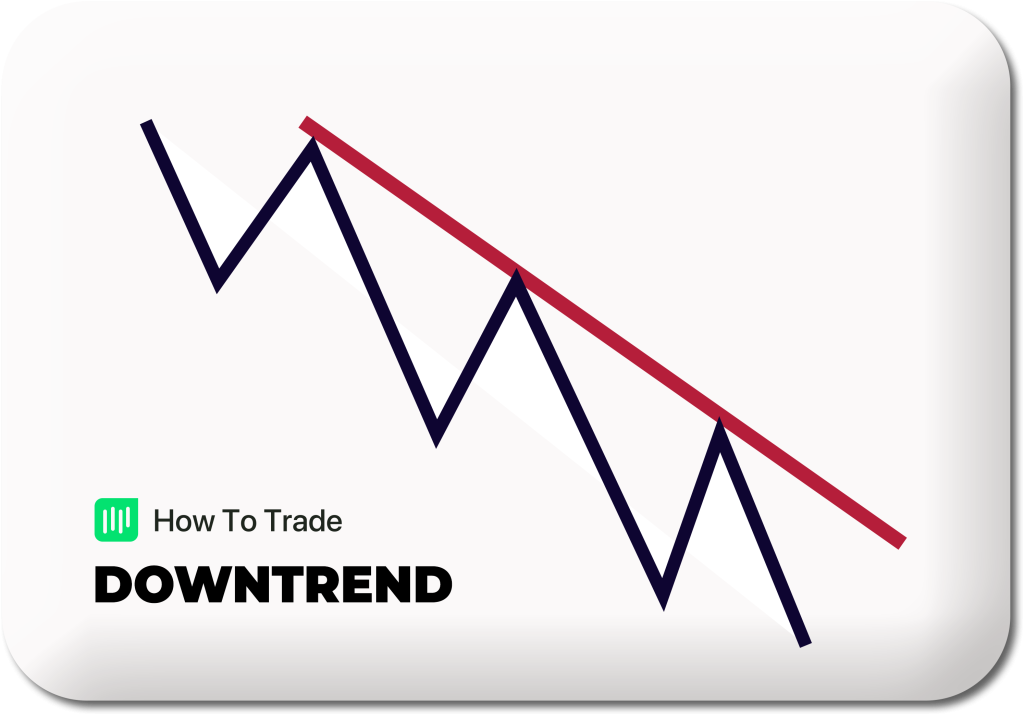
Conversely, a downtrend line exhibits a negative slope established by connecting two or more high points of a currency pair. For the line to maintain a negative slope, the second high point must be lower than the first. In contrast to uptrends, these bearish trendlines indicate that prices of a financial instrument are falling and will continue to fall as long as the trend line continues.
IMPORTANT TIP: When you draw trendlines, at least three points must be connected before the single line is considered to be a valid trend line. If the trade price breaks below or above the trend line, then the trader can identify trend reversal and the direction of the trend.
Let’s see what Uptrend and Downtrend trend lines look like on an actual Forex chart.
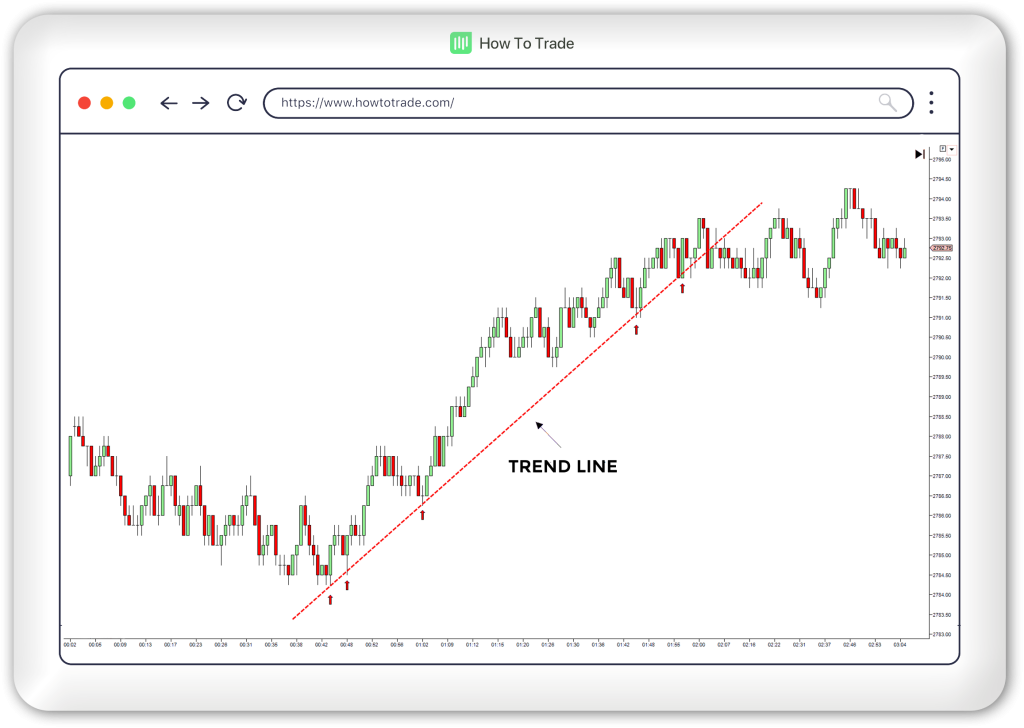

Drawing Three Touch Trend Lines
Drawing trendlines correctly in the forex market is quite easy. All you have to do is locate two major tops or bottoms in price points on the chart and connect them.
Want to see another example of what a downtrend and an uptrend look like on a price chart?
Here’s how it’s done.

Since there is no directional trend, sideways trends can be very frustrating for short-term and trend traders. At the same time, if used correctly, it is one of the most boring but rewarding trendline analysis methods for forex traders.
As a general rule, according to this trading strategy, experienced traders sell the asset when the price approaches resistance lines and buy the asset when it touches the horizontal support line. If the trendline breaks above or below on any chart time frame, it signals a new trend reversal, prompting traders to set a stop loss order at one of the sideways lines. Nonetheless, you need to consider that there’s a significant risk when trading trendline breakouts, as there are many false breakouts. To solve this problem, many traders wait for the first candlestick to end and then enter a trade.
Key Takeaways
- Trend lines are a powerful tool in technical analysis for Forex trading, giving traders a clearer picture of the price action trends without focusing on fundamentals like historical business performance or market news.
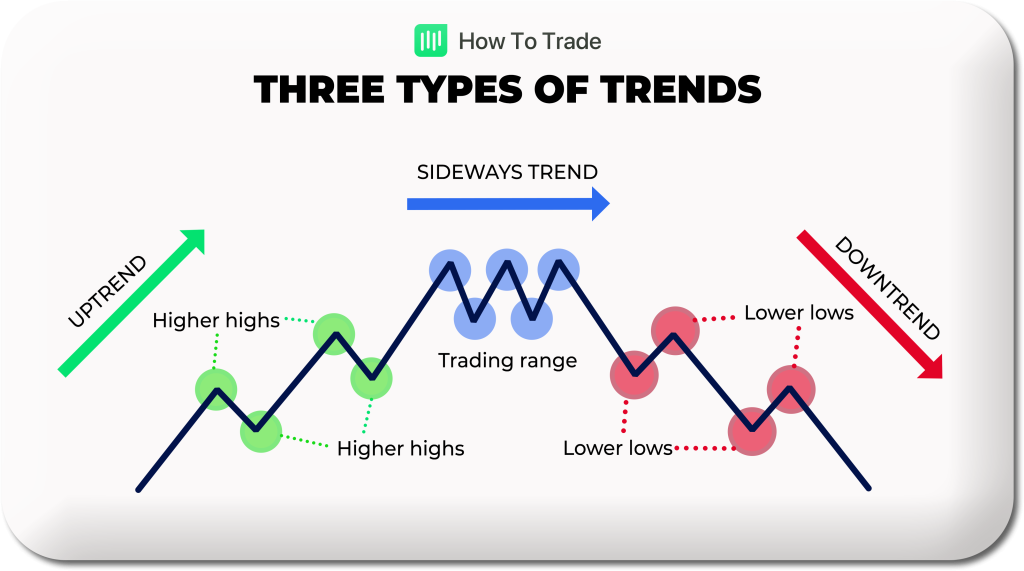
- There are three main types of trend lines in Forex trading: uptrend (connecting higher lows with a upward slope), downtrend (connecting lower highs with a downward slope), and sideways trend (indicating a neutral, range-trading market).
- To draw a valid trend line, at least two tops or bottoms must be connected, but three points are needed to confirm the trend line. In uptrends, trend lines are drawn below the price; in downtrends, above the price.
- Sideways trends occur when supply and demand are nearly equal, leading to horizontal price movement. Traders typically buy at support levels and sell at resistance levels within these trends, although false breakouts pose a risk. In fact, most trend trading strategies revolve around selling at resistance and buying at support.
- A minimum of two tops or bottoms is required to draw a trend line, but three price movements are needed for confirmation. Traders are cautioned against forcing trend lines to fit market scenarios; if a trend line doesn’t fit, it should be disregarded.
If you ever get confused, we have prepared a little cheat pic.
Feel free to download it by clicking below.
REMEMBER: It takes at least two tops or bottoms to draw a valid trend line but it takes THREE moving upwards or downwards price movements points to confirm a trend line.
Most importantly, never force trend lines to fit the forex market scenario. If it doesn’t fit, you must acquit.


Up To $5,000 Credit!
- Trade 1,000’s of global markets.
- 0% deposit and withdrawal fees.
- Rapid funding turn-around times.
- Trade on MetaTrader 4 and 5.