What is Forex Technical Analysis
In the previous lessons, we learned about fundamental analysis and the macroeconomic factors that affect currencies’ prices.
The other half of forex analysis is technical analysis, and that’s what we’re doing in this lesson. We’ll briefly explore the basics of technical analysis and the most important aspects you need to know to start using this trading strategy.
What Is Technical Analysis In Forex Trading?
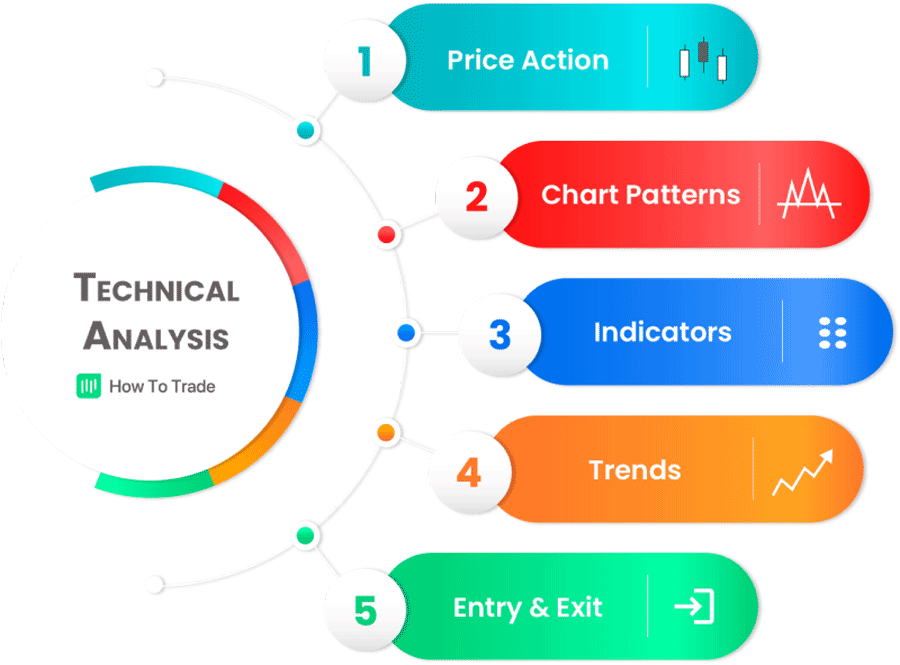
In forex trading, technical analysis is a market evaluation methodology that helps traders predict the next direction of currency pairs’ prices based on historical price movements and chart patterns. According to technical traders, markets always move in repetitive patterns that can be seen and identified in trading charts.
Technical analysis can generally be used on most traded financial instruments and all asset classes. However, due to the structure and high liquidity of the forex market, technical analysis is more popular here. Further, it is mainly used by traders with short-term investment objectives rather than long-term investors.
This trading discipline is one of the most popular and efficient techniques used by technical analysts and investors in the forex market to determine future prices and find trading opportunities. While fundamental analysis helps a trader evaluate the intrinsic value of an asset in financial markets, technical analysis focuses on predicting future price movements by using repetitive patterns and statistical algorithms.
The Key principles of technical analysis
Technical analysis relies mostly on the following principles.
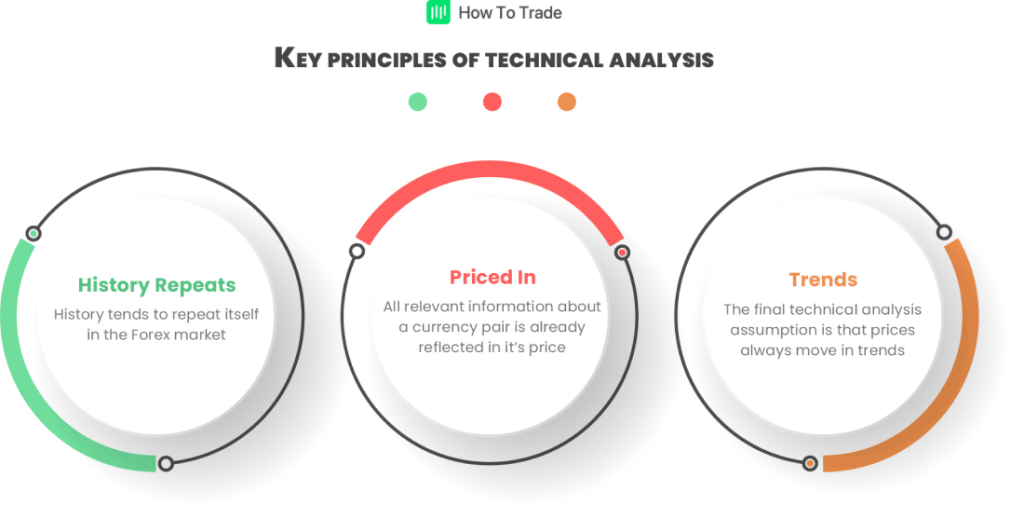
1. Markets move in repetitive patterns
The idea of technical analysis is that history repeats itself. With this notion, traders are essentially looking for an asset’s past price patterns. By using this historical data, they can potentially predict the next direction.
For example, assume the EUR/USD reaches a certain level it has found hard to surpass in the past. A technical analyst trader will use this data to take a short-selling position. They’ll do this with the expectation that the price will fail to surpass that level again.
2. The market discounts everything
Another key principle is that all the data and price action – including market news, price expectations, forecasts, data, and interest rates – are priced into the volume and assets’ price that is shown in the price charts. In other words, they believe that fundamental analysis is less necessary than technical analysis as all the data is simply priced into the chart.
3. Prices in the forex markets always move in trends
The final technical analysis assumption is that prices always move in trends. A trend refers to price direction. So uptrend means upward movement, and downtrend means downward direction.
So, the technical trader believes that once the current trend has started, they can take trades according to this trend until it changes. In an uptrend, technical traders look for buy trades; in a downtrend, technical traders look for sell trades.
Most technical analysis trading strategies and indicators are based on this assumption.
Does Technical Analysis Really Work In Forex Trading?
Yes, it works. Many traders with successful trading experiences in the forex markets used technical analysis as their primary trading strategy. But obviously, that’s subjective to every trader’s personality and type of trading.
One thing to remember is that technical analysis is not a crystal ball. It’s best when combined with fundamental analysis and establishing the skill of getting a sense of market sentiment. Nonetheless, there’s no doubt that technical analysis helps many forex traders to identify trading opportunities in the market.
Moreover, one key reason technical analysis works in forex trading is that the forex markets, unlike the equity markets, are open 24/7. This creates clearer chart patterns and more trading data. Forex traders use these factors to trade during high and low volatility.
Another important reason technical analysis is such a vital tool is that many forex traders keep an eye on the same levels and pivot points. This herd behavior, where individual traders create groups, often helps them identify the same candlestick patterns and collectively predict prices’ future direction.
“Technical analysis works precisely because people look at it. And if people care, I care.”
John Bollinger
How Technical Analysis Works in Trading?
Technical analysis works based on two main factors:
1. Charting Platform
Forex charts are graphs that record how the exchange rate between currency pairs (the price) has changed in the past and how it’s changing in the present.
Why do you need this information? Because technical analysis is predicated on the concept that the forex market is repetitive. So, if you can spot a pattern in the past, you can expect the pattern to play out in the future.
A charting platform is just a platform that provides you with trading charts. Many times, forex brokers offer you charting software with their trading platform. Some even use the MetaTrader4 trading platform, the most popular yet.
2. Trading Tool
The trading tool is another important aspect of technical analysis. In fact, this is where things get subjective. Some technical traders prefer to use technical indicators, while others will stick to price action.
Forex indicators are algorithms or lines of code that run based on mathematical calculations. They’re used to predict price movements. Common examples of indicators are the Relative Strength Index (RSI) and Moving Averages.
On the other hand, price action traders use chart patterns to predict price movements. Common examples of price action tools are trend lines, support and resistances, candlestick patterns, and chart patterns.
Regardless of your preferred trading tool, however, brokers offer demo accounts with which traders can hone their technical skills.
Key Takeaways
- Technical analysis uses past price movements and patterns to predict future price movements.
- This idea is mainly predicated on the fact that the price moves in patterns that are constantly getting repeated in the future.
- Technical analysis is not possible without charting software. Charting software is a platform that records past price movements and tracks current market prices.
- Technical traders rely on trading tools, such as indicators and price action, to identify trading opportunities.
The Bottom Line
To sum up, technical analysis is a vast subject with lots of patterns, indicators, and different analysis methods.
So, to help you get all the necessary technical analysis tools, we’ll cover all the basics and advanced-level technical analysis topics in the next courses. This includes types of forex charts, Japanese candlestick chart patterns, Fibonacci support, and resistance levels, using moving averages in forex trading, and learning how to trade with multiple time frames. See you there.


Up To $5,000 Credit!
- Trade 1,000’s of global markets.
- 0% deposit and withdrawal fees.
- Rapid funding turn-around times.
- Trade on MetaTrader 4 and 5.