The 3 bar play pattern is a technical indicator used by traders to identify potential continuations or reversals of existing trends. It consists of three (or sometimes four) consecutive candlesticks that signal continued buying or selling pressure after a brief pause in the trend.
- The 3 Bar Play Pattern is a popular candlestick formation used by traders to identify strong momentum breakouts in either direction.
- This pattern consists of two smaller bars followed by a large third bar, indicating a sharp increase in buying or selling pressure.
- Traders typically use the 3 Bar Play for short-term trades, focusing on the third bar’s size and position for entry signals and potential high-reward setups.
But, you must know the factors and strategies to identify and trade the 3 bar pattern. This article will teach you how to recognize, interpret, and trade this chart pattern.
- What is the 3 Bar Play Pattern?
- How to Identify and Use the 3 Bar Play Pattern in Trading?
- The 3 Bar Play Trading Strategy (With Examples)
- How Do You Combine the 3 Bar Play with Other Indicators for Stronger Signals?
- What are the Benefits and Limitations of the 3 Bar Play Pattern
- Key Takeaways
- Frequently Asked Questions
What is the 3 Bar Play Candlestick Pattern?
The 3 bar play is a common chart pattern characterized by three (or four) consecutive candlesticks that may appear in a downtrend, uptrend, or neutral market.
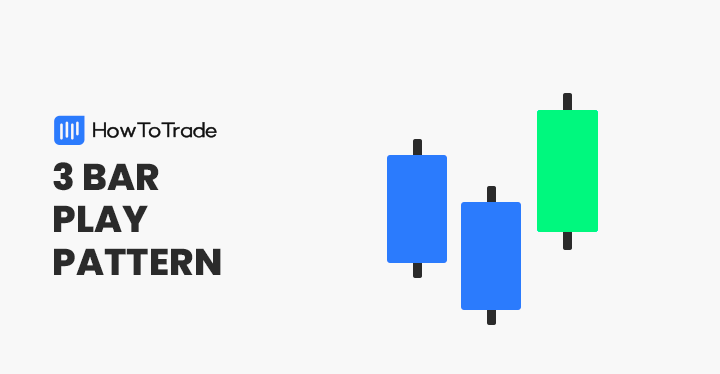
The three-bar play pattern consists of:
- First Bar: This is typically a strong and directional bar. It could be bullish or bearish, showing decisive market action.
- Pullback Bar: Also called the rest bar, this acts as a consolidation phase. It might be small or show a slight retracement, indicating a pause in the trend.
- Breakout Bar: The third bar, also known as the trigger bar, decisively confirms the continuation or reversal of the trend. It should be a strong bar again, moving in the same direction as the first bar and ideally surpassing its high (for uptrends) or low (for downtrends).
Depending on where it appears, the 3 bar play pattern can be a continuation or a reversal pattern. If, for instance, we have an established trend and the pattern appears in the direction of that trend, it’s a continuation pattern. But if we have a dying trend, and the pattern appears in the opposite direction to that trend, the 3 bar play serves as a reversal pattern.
How to Identify and Use the 3 Bar Play Pattern in Trading?
One of the key advantages of the 3-bar play pattern is that it’s easy to identify and use this pattern. After all, like the three black crows and the downside and upside three method price patterns – it is a three-candle pattern that may appear in any market scenario and can provide either bullish or bearish signals.
1. Locate your First Bar
This is the first and easiest step. Any strong candlestick could potentially be your first bar. If it appears in the direction of the current trend, you may have a continuation 3-bar play in progress. But if it appears in the opposite direction to the current trend, especially when that current trend is petering out, you might have a reversal on your hands.
2. Identify your consolidation
What comes next after your first bar is the consolidation or slight pullback candle. You’ll often see this as a significantly smaller candlestick in the opposite direction to the first. It could even be a doji, pin bar, or inside bar.
3. Wait for your trigger candle
The third and final candlestick is called the trigger candle. It is another strong candlestick in the direction of the first, confirming the continuation of the current trend or the reversal of the previous.
With that in mind, let’s see an example of the three-bar play pattern on a price chart:
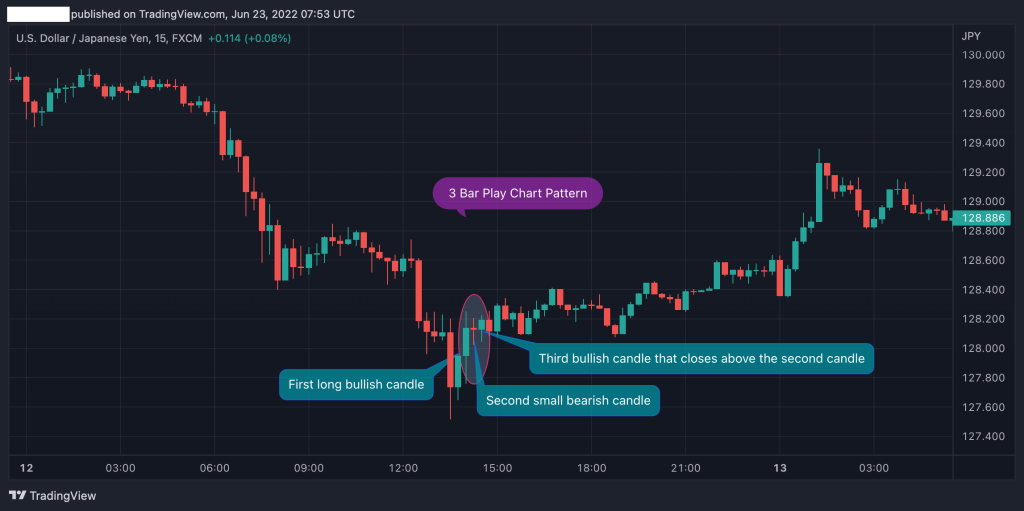
As you can see in the USD/JPY 5-minute chart above, the 3 bar play pattern appears at the end of a downtrend. The first bar is long and signals that a change in trend might occur.
The second candle is bearish and forms a Doji candlestick chart pattern, meaning it is a narrow range bar that indicates indecision in the market.
Once the third bar rises above the second candle, the 3-bar play pattern is confirmed, and a buying signal is made with a stop loss below the lowest level of the first candle.
The 3 Bar Play Trading Strategy (With Examples)
The 3-bar play pattern usually indicates a trend change in the market. Often, it appears in a ranging market where prices consolidate, and the third or fourth candle suggests that the market is likely to get out of the range.
As we mentioned, using the 3 bar play pattern can be either for taking a long or short position. When the 3 bar play pattern appears, a trader usually enters a position once the third candle rises above the second, with a stop loss below the lowest level of the first candle. That’s the idea of this chart pattern.
That said, you must know how to identify and confirm the pattern. So below, we will show you the two formations of the 3 bar play pattern in combination with momentum indicators that may help you confirm the pattern.
1. Rising Three Bullish Bar Play Pattern
The rising three-bar play pattern is the bullish version that signals a buying entry point signal. Typically, it can appear following a downward trend or during an ongoing bullish uptrend.
In our example, the rising 3 bar play pattern appears at the end of a bearish trend and has the formation of three candlesticks that signal to enter a long position.
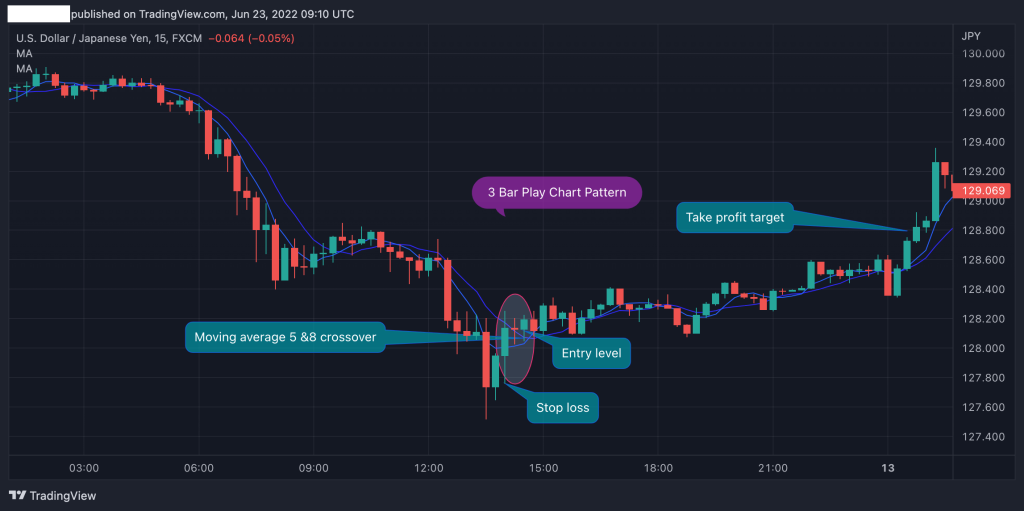
The entry level would be at the opening price of the third candle, as long as it rises above the closing price of the second candle. Then, a stop loss should be placed at the lowest level of the first candlestick, and the take-profit target should be placed at the last price peak of the previous downtrend.
Lastly, we added a moving average indicator to confirm the trend reversal. In this case, we use the 5 &8 bars to match the data for short-term timeframes. As you can see, the crossover occurs at the exact level when the third candle rises above the second one.
2. Falling Three Bearish Bar Play Pattern
Trading the falling three bar play pattern works the same as trading the rising three bullish pattern, but the structure is obviously different. This means you’ll have to look for a long bearish candle followed by a small bullish candle and another third bearish candle that falls below the second candle.
Once again, we want to show you what the pattern looks like on a trading chart and the tools you should use to confirm the pattern. In the example below, we used two moving averages to confirm the pattern – 5 and 8 bars.
Then, a selling signal is made when we notice the MA crossover and the third candle falls below the second candlestick.
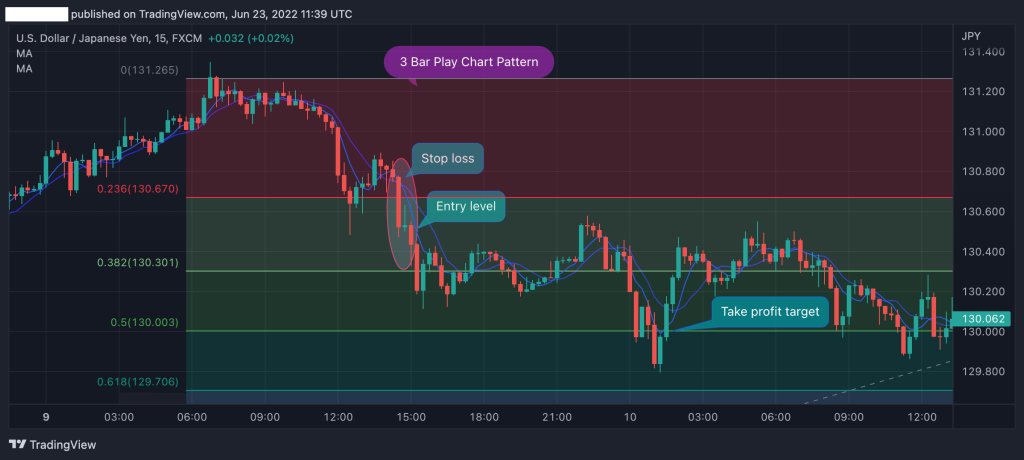
As you can see in the USD/JPY 15-minute chart, this time, the 3 bars play patterns during a downtrend trend, which signals the continuation of the trend.
Further, we added Fibonacci retracement support and resistance levels of the previous price swing to find a take-profit target. Once the third candlestick breaks below the second candle, the next profit target would be the 50% retracement line.
How Do You Combine the 3 Bar Play with Other Indicators for Stronger Signals?
The 3 bar play pattern is a fantastic tool for identifying potential trend continuations, but like any good detective, it doesn’t work alone. Many traders combine the 3 bar play with other technical indicators to gather more evidence and strengthen their trade signals. Let’s explore some popular pairings:
1. Moving Averages
Moving averages can provide a clear view of the overall trend direction. If a 3-bar play appears and aligns with the direction of the moving average, it strengthens the continuation signal. At the same time, if the 3 bar play pattern crosses the moving average to the other side, that could be a strong sign that the trend is, indeed, about to reverse. Finally, if you have two moving averages crossing at the same time in your 3-bar pattern, this could also serve as a strong confirmation signal.
Having said that, it’s important to note that moving average periods will determine what kinds of signals you’ll be getting. If your period is too large, chances are that all you’ll have are continuation signals. But if your moving average period is too low, you might get caught up in false reversals often.
We recommend that you use either the 20 EMA or the 50 EMA. Even then, this is not a law, as your choice of moving average period ultimately depends on your trading system.
2. Support and Resistance Levels
Support and resistance zones are like established boundaries in the market. A 3 bar play becomes even more interesting when it occurs near these levels. If the pattern respects these boundaries, it suggests a more powerful continuation play. And when the pattern breaks a support or a resistance, this could make a strong case for reversal traders.
3. Momentum/Oscillating Indicators
Sometimes, the market can get a little too enthusiastic (overbought) or downright sluggish (oversold). This is where momentum indicators like RSI or Stochastic Oscillators come in. They can help us gauge these moods. A 3 bar play following a reading that suggests the market isn’t at an extreme adds confidence to the continuation story.
4. Volume
A strong increase in volume on the breakout bar (third bar) of the 3-bar play strengthens the continuation signal. It tells us there’s real buying or selling pressure behind the price movement, not just a quiet shuffle.
What are the Benefits and Limitations of the 3 Bar Play Pattern?
Here are the pros and the cons of trading the 3 bar play pattern:
Pros
- Easy to identify
- Very common chart pattern in intraday time frames – ideal for day trading
- It offers an excellent signal for short-term trading strategies
Cons
- Mostly suited for short-term trading
- Sometimes provides misleading signals
Key Takeaways About the 3 Bar Play Pattern
Here are the key takeaways from trading the 3 bar play pattern:
- The 3 bar play is a three-candle pattern that offers a reliable signal to enter or exit a trade
- The pattern is made of three (or four) candlesticks and is confirmed when the third candle rises (or falls) above or below the second rest bar (if bullish or bearish)
- The 3 bar pattern offers an excellent fit for day trading strategies and for day trading setup
- When trading the three-bar play pattern, it is advisable to use other indicators such as moving averages, MACD, and Fibonacci support and resistance levels to confirm the pattern is valid
- A stop loss should be placed below (or above) the lowest or highest level of the first candle
Frequently Asked Questions About the 3 Bar Play Pattern
Here are the most frequently asked questions about the 3 bar play chart pattern:
Is a 3 bar play bullish or bearish candlestick chart pattern?
The 3 bar play pattern can be either a bullish or bearish candlestick chart pattern, depending on its location on trading charts.
What is the difference between the 3-bar play pattern and the 3-bar reversal pattern?
There’s a similarity between the 3-bar play pattern and the 3-bar reversal pattern. They both consist of three candles and signal an entry-level. However, there’s a difference in the structure and formation of the two patterns. The 3 bar play pattern has a formation with a first bullish solid candle (the initial bar), followed by a second small bearish candle, and a third bullish candle that closes above the second candle. On the other hand, the 3 bar play reversal pattern has two descending bearish candles and a third bullish candle that closes above the first.
What happens after the 3-bar play candle pattern?
Usually, when the 3 bar play pattern appears, and the third candle rises or falls above or below the second candle, the trend will continue in the same direction as the third candle.
Risk Disclosure: The information provided in this article is not intended to give financial advice, recommend investments, guarantee profits, or shield you from losses. Our content is only for informational purposes and to help you understand the risks and complexity of these markets by providing objective analysis. Before trading, carefully consider your experience, financial goals, and risk tolerance. Trading involves significant potential for financial loss and isn't suitable for everyone.