The bullish harami candlestick formation is a trend reversal pattern that occurs at the end of a downward trend and signals a buying opportunity.
In this article, we’ll explain what is the bullish harami pattern, what are its characteristics, and how to identify and trade this charting pattern.
What is the Bullish Harami Candlestick Pattern?
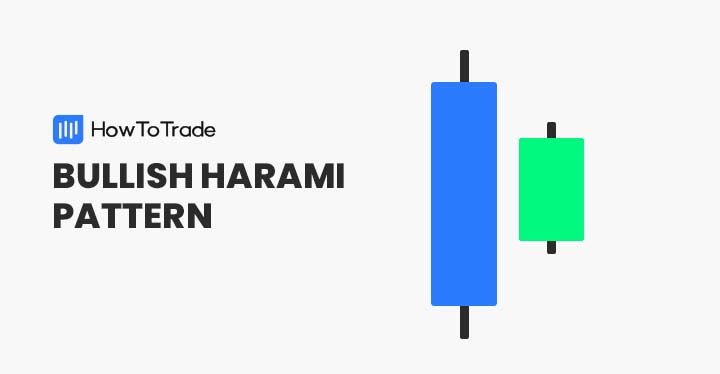
The bullish harami candle pattern is a Japanese candlestick formation formed at the bottom of a bearish trend and indicates that the trend is about to reverse.
In appearance, the pattern consists of two candles one after the other with the first bearish candle having a long body and short upper and lower wicks and the second bullish candle having a very small body.
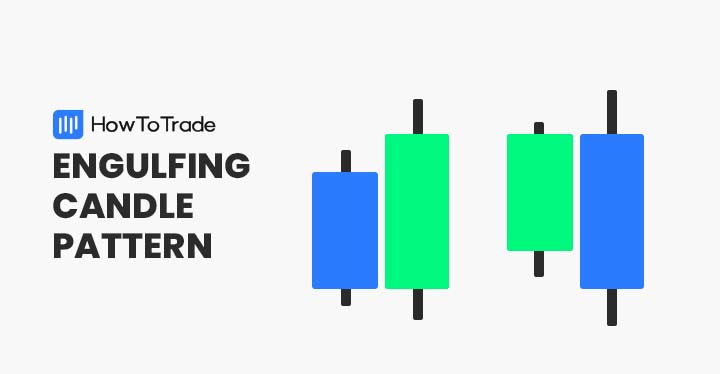
The name “Harami” comes from Japanese and means pregnant due to the fact that the formation is similar in appearance to a pregnant woman. There are two types of Harami candle patterns, the bullish and bearish harami candlestick pattern.
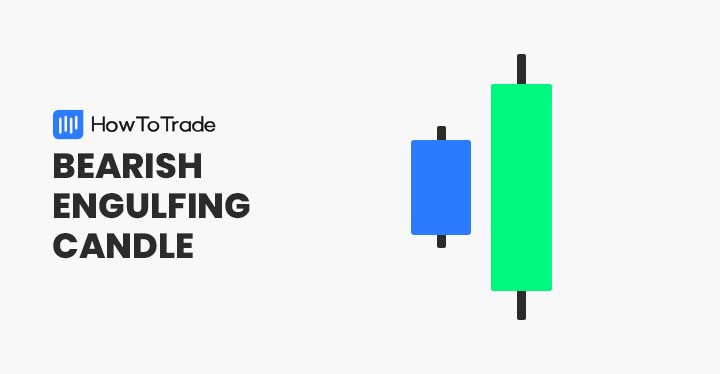
The only difference is that the bearish harami pattern appears at the end of an uptrend and has the opposite outcome that the bullish harami setup.
How to Identify and Use the Bullish Harami Candlestick Pattern?
Generally speaking, the bullish harami is a two candlestick pattern formed at the bottom of a downward trend. The pattern consists of a long bearish candlestick, followed by a bullish candlestick with a small body. The second candle should be around 25% of the length of the previous bearish candle.
Therefore, to identify the pattern, you need to find a two candle pattern at the bottom of a downward trend with the above features. Let’s see how the pattern looks on a price chart.
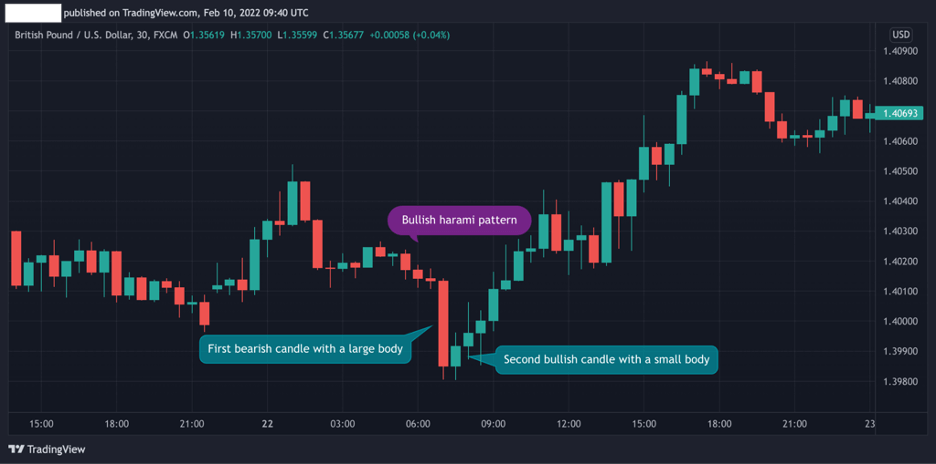
As you can see in the GBP/USD chart above, the first bearish candle has a longer body and appears at the bottom of a downtrend. The following bullish candle has a small body and short lower and upper wicks. Eventually, the trend reversal is confirmed and the price changes direction.
Here are some rules and techniques you need to follow to use the bullish harami candle pattern:
- Identify the bullish harami pattern at the bottom of a downward trend
- Add another momentum or oscillator indicator to confirm the trend reversal – MACD, RSI, CCI, Stochastic, etc
- Wait for the next candle following the second bearish candle to close above the highest price
- Enter a long position with a stop-loss order below the lowest level of the first bearish candlestick
How to Trade the Bullish Harami Candlestick Pattern?
Identifying the bullish harami pattern on a trading chart is fairly straightforward and easy. However, finding the pattern is usually not enough and you’ll need to combine it with other indicators in order to confirm the pattern.
Below, we are going to show you how to confirm the bullish harami pattern and find good entry and exit levels by using the RSI, MACD, and Fibonacci ratios.
1. The Bullish Harami Chart Pattern with MACD and RSI
Since the bullish harami is a trend reversal pattern, you want to confirm the reversal with another momentum indicator. The MACD and RSI are two of the most important momentum indicators that you can use when identifying the bullish harami pattern.
In the chart below, we added the RSI and MACD so we can confirm the price reversal.
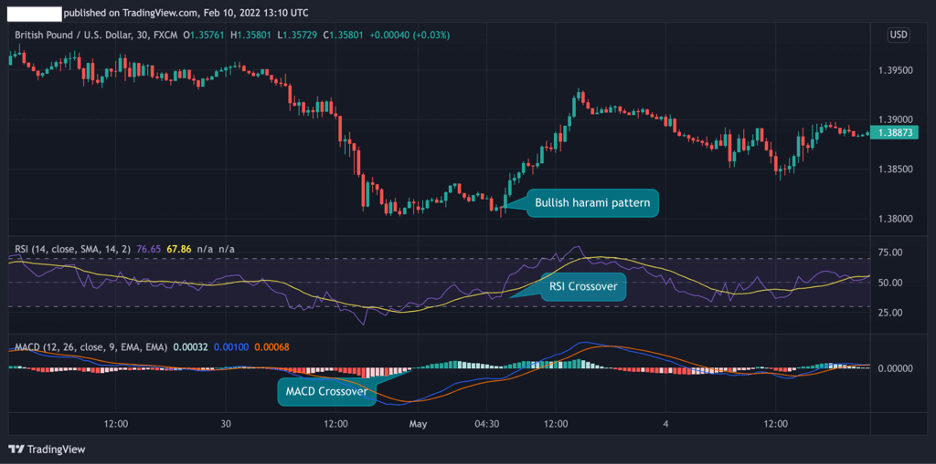
As seen in the GBP/USD 30-min chart, the RSI crossover occurs exactly at the same time when the bullish harami appears and is above the 30 level. The MACD crossover, on the other hand, occurs even before the pattern occurs which provides a strong indication that the momentum of the bearish trend is over.
2. The Bullish Harami Chart Pattern with Fibonacci Retracements
Using Fibonacci retracement levels in combination with a bullish harami pattern as a trading strategy could be tricky. You’ll have to identify the previous highs and lows of the previous trend to correctly draw Fibonacci levels and occasionally, you might even have to change a timeframe.
Nonetheless, when you are able to find the boundaries of the previous trend, Fibonacci support and resistance levels can help you confirm the trend reversal and find the right entry level.
In the chart below, we have drawn Fibonacci retracement levels from the highest to lowest prices of the previous trend. As you can see, the 61.8% level helps us find a good entry level. Moreover, the stop-loss could be placed at the 78.6% level and the take profit target at 50%, and 38.2%.

The Bullish Harami Candlestick Pattern – Pros and Cons
Here are the most common pros and cons of trading the bullish harami candlestick pattern:
Pros
- Easy to identify
- Potential for high reward trade as the pattern occurs at the beginning of a bullish trend
- Effective chart pattern when used in combination with other technical indicators like the MACD and Fibonacci support and resistance levels
Cons
- Considered as a sigh risk trade as you basically enter a long position at the bottom of a downward trend
- Requires other technical indicators to confirm the trend
- The pattern does not occur frequently
Everything About the Bullish Harami Candlestick Pattern in One Video
Watch this video to learn more about how to identify and trade the bullish harm pattern.
Key Takeaways
To sum up, here are the key takeaways you need to remember about the bullish harami pattern:
- The bullish harami is a two candlestick chart pattern that appears at the end of a downward trend and signals that the current is about to reverse.
- The pattern is comprised of one long bearish candle followed by a small bullish candle
- It is best to use other technical indicators to confirm the trend reversal pattern. Those include MACD, RSI, Stochastic
- Adding Fibonacci support and resistance levels could help in placing stop-loss orders a take profit target
Risk Disclosure: The information provided in this article is not intended to give financial advice, recommend investments, guarantee profits, or shield you from losses. Our content is only for informational purposes and to help you understand the risks and complexity of these markets by providing objective analysis. Before trading, carefully consider your experience, financial goals, and risk tolerance. Trading involves significant potential for financial loss and isn't suitable for everyone.