Do you trade Japanese candlestick chart patterns? Is the bearish engulfing pattern part of your game plan?
If not, be sure to check out the rest of this article. In it, we’ll teach you all about engulfing patterns and how to use them to take your trading to the next level.
- What is the bearish engulfing candle?
- How to identify and use bearish engulfing patterns?
- How to trade the bearish engulfing candlestick pattern?
- Trading example
- The bearish Vs. bullish engulfing pattern
- Bearish engulfing candle patterns – Pros and cons
- Bearish engulfing candle (VIDEO)
- Key takeaways
What Is The Bearish Engulfing Candle?
The bearish engulfing pattern is a two candle formation local to Japanese candlestick price charts. It consists of a positive candlestick (green) followed by a more significant negative candle (red) that completely encapsulates or “engulfs” the previous candle.
Bearish engulfing patterns are considered to be reversal technical analysis indicators and are part of the classical chart patterns group.
Traders view this pattern as a signal to sell a currency pair, commodity, or CFD. It occurs at or near the top of a bullish trend and suggests that price-action pullback is imminent.
How To Identify And Use Bearish Engulfing Patterns?
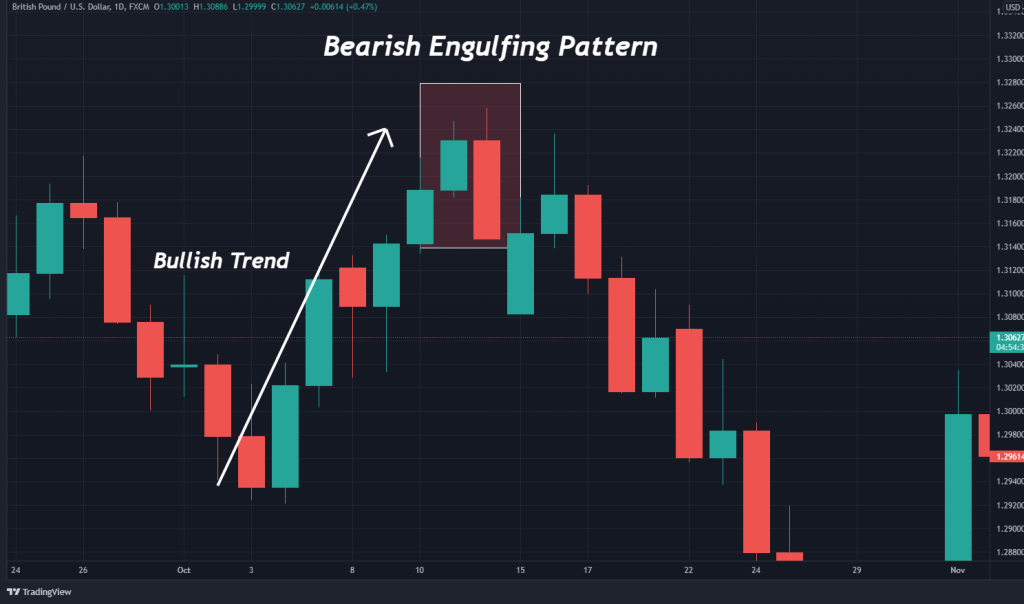
Technical analysis is the primary decision-making apparatus for legions of active traders. Accordingly, the bearish engulfing pattern is a popular element of countless reversal trading strategies. The GBP/USD chart below gives us a good look at the bearish engulfing pattern.
Here’s how to apply this formation to your trading:
- Identify a prevailing bullish trend.
- Pinpoint a defined, positive first candle
- Locate a larger, bearish second candle that encapsulates the first
- Be ready to sell the market beneath the low of the second candle
Identification
One of the great things about the bearish engulfing candle pattern is that it is easy to identify. It is a two candlestick formation that consists of the following elements:
- First Candle: The first candle is a bullish candle that occurs during a prevailing uptrend. It illustrates that buying pressure is present in the market.
- Second Candle: The second candlestick is a larger, bearish candle. It signals that a bearish reversal of the prevailing uptrend may be in the offing.
Interpretation
The bearish engulfing pattern occurs within the context of a bullish trend. It is a reversal pattern that suggests that considerable selling is likely to enter the market.
Traders look upon the bearish engulfing pattern as a means to sell currency pairs. For instance, if the formation shows up in the EUR/USD, a trader may decide that a bearish reversal is probable. To get in on the action, the trade would sell the EUR/USD.
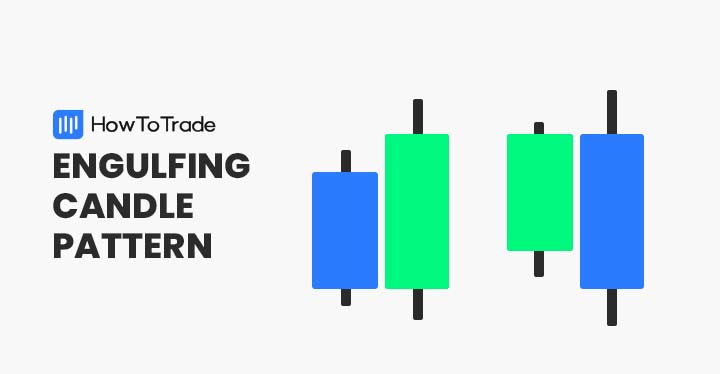
Bullish and Bearish
Engulfing patterns come in two types: bullish and bearish. Each has a unique construction and signals opposing price action.
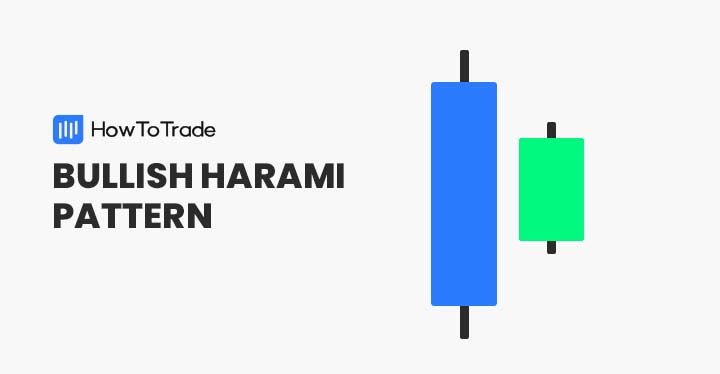
- Bullish Engulfing Pattern: A bullish engulfing pattern occurs during a downtrend. It is made up of a negative candle followed by a more significant positive candle. The bullish engulfing candle is a signal to buy the market.
- Bearish Engulfing Pattern: The bearish engulfing pattern develops during an uptrend. It comprises a positive candle followed by a more significant negative candle. The bearish engulfing formation is a signal to sell the market.
How To Trade The Bearish Engulfing Candlestick Pattern?
After identifying the bearish engulfing formation, there are three steps to trading the pattern: locate the market entry, set a stop loss, and decide on a profit target.
1. Market Entry
To determine market entry using bearish engulfing candles, you need to focus on the second candlestick of the pattern. Upon the second candlestick fully forming, it is time to enter a sell order beneath the lower extreme of this candle. By doing so, you can gain exposure to any bearish reversals.
2. Stop Loss
Locating a viable stop-out point with the bearish engulfing formation is straightforward. Stop losses are placed above the upper extreme of the pattern. Given that the second candle represents both the formation’s high and low, your stop loss will be placed above the second candlestick’s high.
3. Profit Targets
There’s a multitude of ways to set profit targets. A few of the most common are in adherence to risk vs. reward ratios, pattern height, or percentage gain.
For the bearish engulfing pattern, profit targets are as tall as the pattern itself. So, a viable profit target is placed beneath the formation, with at least a 1:1 risk vs. reward ratio with regard to the second candle’s range.
Trading Example
Trading the bearish engulfing pattern is pretty routine. The GBP/USD chart below gives us a solid illustration of how to trade this bearish reversal pattern.
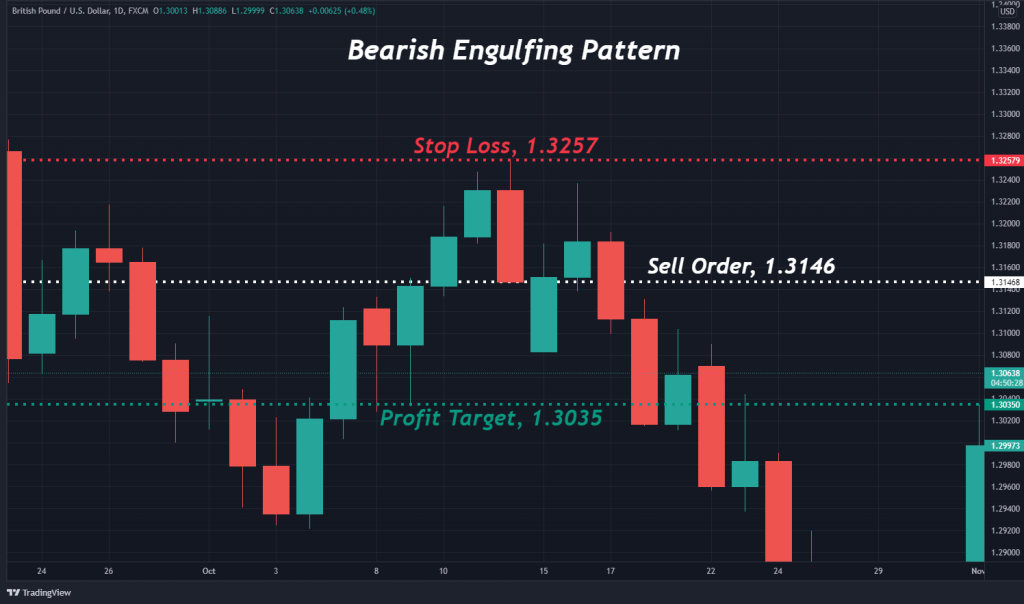
Here’s how the GBP/USD short above was executed:
- An uptrend and bearish engulfing candle was observed.
- A sell order was entered beneath the second candle at 1.3146.
- A stop-loss order was placed above the second candle at 1.3257.
- A profit target was located at 1.3035, a 1:1 ratio of the formation’s height.
- Upon the profit target being hit, a gain of 111 pips was realized.
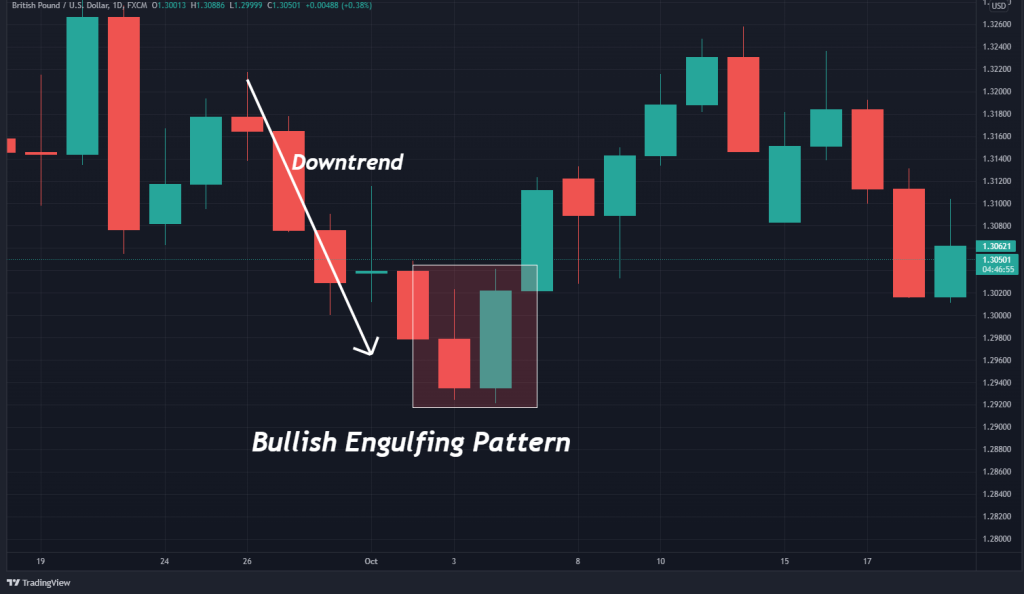
The Bearish Vs. Bullish Engulfing Pattern
Engulfing patterns come in two primary varieties: bearish and bullish. Below is a look at the fundamental differences:
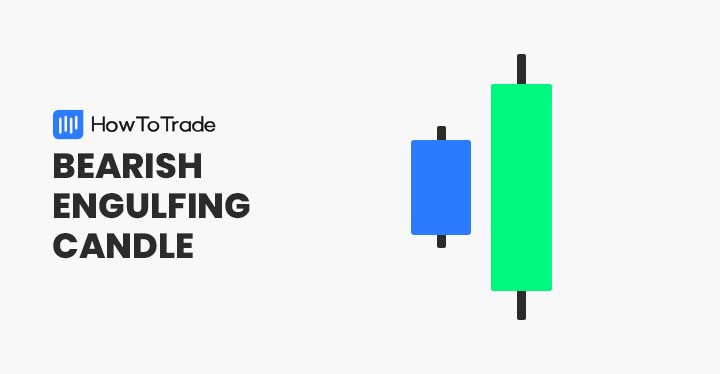
- Bearish: The bearish engulfing pattern consists of a bullish candle followed by a larger, bearish candlestick. It is a sell signal that suggests falling prices are to come.
- Bullish: The bullish engulfing pattern consists of a bearish candle followed by a larger, bullish candlestick. It is a buy signal that suggests rising prices are to come.
The chart below shows the bullish engulfing pattern. Notice how its structure and location differ from the bearish engulfing pattern.
Bearish Engulfing Candlestick Patterns – Pros and Cons
Regardless of the analytical base, indicator, or tool, traders must weigh the pros and cons before adopting the methodology. Here are a few key advantages and disadvantages of the bearish engulfing candle:
Pros
- It frequently occurs in all markets on all timeframes.
- Ideal for reversal trading strategies
- Can produce extraordinary returns as a reversal indicator
Cons
- May generate false signals amid strong bullish trends.
- Loses efficacy in rotational or “flat” markets
- It is expensive to trade on monthly, weekly, and daily timeframes
Everything About the Bearish Engulfing Candle in One Video
Watch this video to learn how to identify and trade the bearish engulfing candle with real-time examples.
Key Takeaways
Here are the key takeaways you need to consider when using the bearish engulfing candle.
- Bearish engulfing candlesticks develop during an upward trend in price. It consists of two candles: an initial positive candle followed by a larger negative candlestick.
- The bearish engulfing formation is classified as a reversal pattern. It is a sell signal that suggests a future downturn in price action.
- Although reliable, this candlestick pattern isn’t infallible. Trading it competently involves adhering to prudent risk management principles.
Risk Disclosure: The information provided in this article is not intended to give financial advice, recommend investments, guarantee profits, or shield you from losses. Our content is only for informational purposes and to help you understand the risks and complexity of these markets by providing objective analysis. Before trading, carefully consider your experience, financial goals, and risk tolerance. Trading involves significant potential for financial loss and isn't suitable for everyone.