A bullish divergence is a vital technical indicator that occurs when there is a miscorrelation between the price of the asset and a momentum or oscillator technical analysis indicator.
For technical traders, this discrepancy between market price and technical indicators is often used as a signal to buy or sell an asset. Let’s see how it works.
- What is the bullish divergence candlestick pattern?
- How to identify and use the bullish divergence candlestick pattern in forex trading?
- How to trade forex using the bullish divergence candlestick pattern – Strategies and examples
- The bullish divergence candlestick pattern – Pros and cons
- Bullish Divergence Pattern (VIDEO)
- Key takeaways
- Frequently Asked Questions (FAQs)
What is the Bullish Divergence Candlestick Pattern?
A divergence is quite a unique phenomenon in technical analysis and trading in general. Basically, it is a ‘disagreement’ between the market price of a certain asset and an oscillator or momentum indicator such as the RSI or the MACD.
When traders identify this divergence phenomenon, they use it as a leading indicator and buy or sell the asset until the market price and the indicator will be in full correlation again.
Much like many other chart patterns, the divergence pattern has two forms – bullish divergences and bearish divergences.
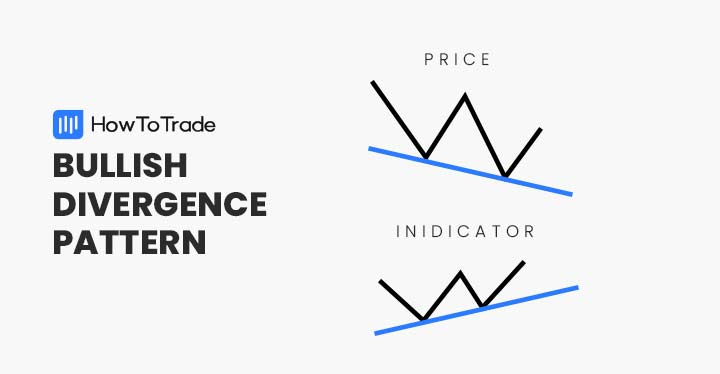
A bullish divergence pattern refers to a situation when the price drops to new lows but the indicator does not follow and signals something different. Generally, the bullish divergence signals an uptrend reversal or a price correction in the market.
Even though it is one of the most complicated patterns in technical analysis, it is also an extremely useful pattern that offers traders lots of trading opportunities. Most importantly, it is a pattern or an occurrence that at some point, you’ll learn how to identify it naturally on price charts. To start with, suggest you download our divergence cheat sheet page, and our RSI divergence chart sheet and MACD divergence cheat sheet.
How to Identify and Use the Bullish Divergence Candlestick Pattern in Forex Trading?
First, in order to identify and confirm the bullish divergence pattern, you need to know how to use technical indicators like RSI, Stochastic, and MACD. These are essentially momentum indicators that help traders determine the strength or weakness of a trend of the specified asset.
Once you have inserted at least one of the indicators into a price chart, the next step is to identify a situation when the price reaches new lows, while the indicator signals something different, meaning creating higher highs. When this happens, a bullish signal is generated and you buy the asset at the lows with the expectation that the price will reverse.
Taking the above into account, here are the steps you need to take in order to identify and use the divergence bullish pattern:
- Identify a situation where the asset reaches new lows and creates two or three bottoms
- Add one of the following indicators to a price chart – RSI, MACD, or Stochastic Oscillator
- Try to find a discrepancy between the market price of the asset and the technical analysis indicator
- Buy the asset at the lows and set a stop-loss order below the lowest level of the last price swing
- Use a risk-reward ratio
How to Trade Forex Using the Bullish Divergence Candlestick Pattern – Strategies and Examples
As we mentioned earlier, there are some reliable indicators that you can use to identify a bullish divergence pattern. These include the following – Relative Strength Index, MACD crossover, and the Stochastic oscillator momentum indicator.
Below, we are going to see examples of each one of the indicators combined with the bullish divergence pattern.
1. Bullish Divergence Pattern RSI (Relative Strength Index)
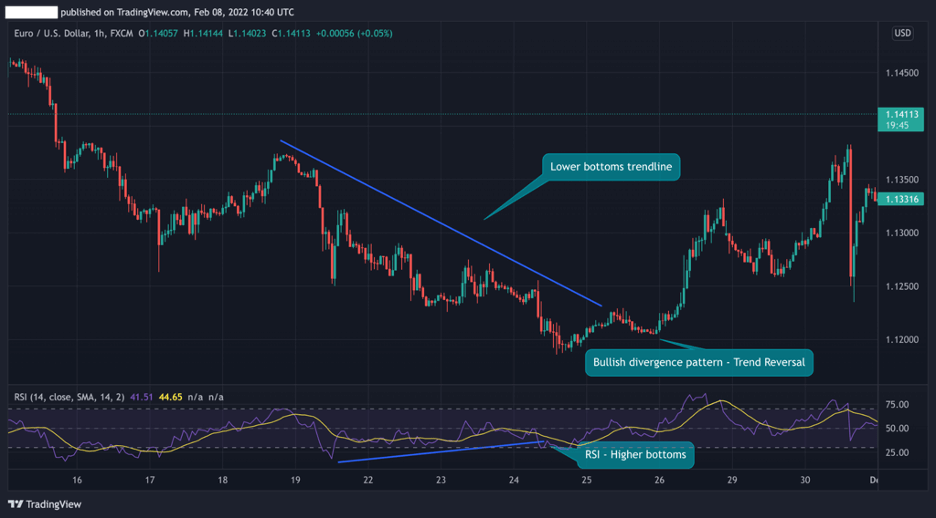
The Relative Strength Index (RSI) is a momentum indicator used to identify overbought and oversold readings in the market. When the RSI shows 70, it means that the market is in an overbought condition, and prices are expected to reverse. On the other hand, if the RSI touches the 30 level, the same logic works in the opposite direction.
In the EUR/USD 1H chart below, we can see how the pair creates lower bottoms while the RSI is moving in the other direction with higher bottoms. In this case, the bullish divergence pattern is confirmed and a trend reversal eventually occurs.
2. Bullish Divergence Pattern MACD (Moving Average Convergence Divergence)
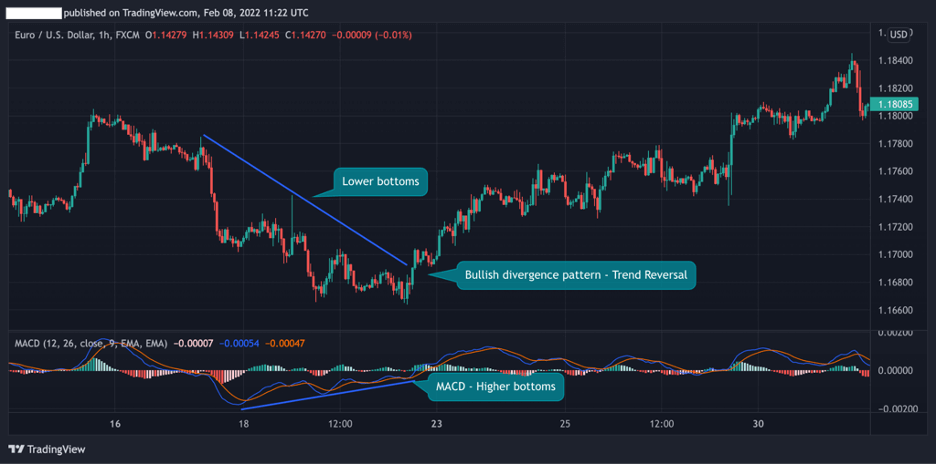
Another technical indicator that can be used to identify the bullish divergence pattern is the Moving Average Convergence Divergence (MACD). Essentially, the MACD measures the asset’s momentum or the strength of the trend and usually indicates the reversal of a trend when the crossover occurs.
As you can see in the EUR/USD chart below, there’s a disagreement between the price of the asset and the MACD indicator. Then, when the MACD crossover happens, the bullish divergence pattern is completed and the price changes direction rapidly.
3. Bullish Divergence Pattern Stochastic Oscillator
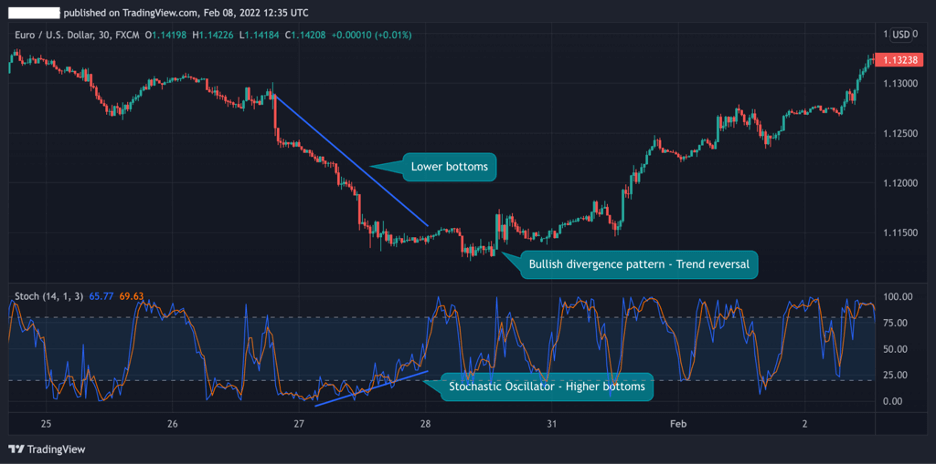
Finally, another technical indicator that helps in identifying the bullish divergence pattern is the Stochastic Oscillator. Similar to the RSI, the stochastic oscillator signals overbought and oversold areas and shows traders the strength of the current momentum and trend.
When the Stochastic indicator is over 80, the market is in an overbought condition, and if the stochastic oscillator is below 20, then it would be considered oversold.
Once again, in the chart below, we added the Stochastic indicator to see how the discrepancy between the market price and the indicator can create a trend reversal.
While the EUR/USD price dropped, the Stochastic moved in the other direction. In this situation, a trader will buy the asset with a stop-loss order below the lowest level of the previous downward trend.
The Bullish Divergence Candlestick Pattern – Pros and Cons
Here are the most common pros and cons for trading the bullish divergence pattern:
Pros
- A very reliable indicator
- Offers lots of trading opportunities, particularly for short-term traders
Cons
- Not easy to recognize and identify on trading charts
- Not a strong indicator. Instead, it is used as another confirmation to enter or exit a position
- Not ideal for beginner traders
Everything About the Bullish Divergence Pattern in One Video
You can check this video by our trading analysts on how to identify and trade the bullish divergence pattern.
Key Takeaways
In a nutshell, here’s what you need to remember about bullish divergence patterns:
- A bullish divergence occurs when the price of an asset is creating new lows while a momentum indicator or oscillator is moving in the opposite direction
- This bullish trend reversal pattern signals that the momentum of the trend is weakening and the trend is about to reverse
- The most reliable indicators to use include MACD, RSI, and Stochastic Oscillator
- Traders often use the bullish and bearish divergence patterns as a lagging indicator as the technical analysis tools precede the asset’s price action
Frequently Asked Questions (FAQs)
Here are some of the most frequently asked questions about the bullish divergence pattern in forex:
What is a hidden bullish divergence pattern?
A hidden bullish divergence occurs when the price is making higher highs while the indicator is making lower lows. It is the opposite of the bullish divergence pattern, however, it has a different meaning. Unlike the bullish divergence pattern, which is a trend reversal pattern and indicates the momentum’s weakness, the hidden bullish and hidden bearish divergence patterns indicate that the trend is about to continue (hence, it is a continuation chart pattern).
What indicators are best for divergences?
Among the best indicators for divergence trading include the RSI, MACD, and the Stochastic Oscillator. Other indicators that also can be used for divergence are CCI and ROC (price rate of change ROC).
Where to place a stop loss when trading the bullish divergence pattern?
Frankly, this is one of the major problems of trading divergences. This trading method does not provide a clear price level to place a stop loss like other chart patterns such as the butterfly pattern or the double bottom chart pattern. Still, when trading the bullish divergence patterns, it is best to place a stop loss below the last bottom of the previous price swing.
Risk Disclosure: The information provided in this article is not intended to give financial advice, recommend investments, guarantee profits, or shield you from losses. Our content is only for informational purposes and to help you understand the risks and complexity of these markets by providing objective analysis. Before trading, carefully consider your experience, financial goals, and risk tolerance. Trading involves significant potential for financial loss and isn't suitable for everyone.