
Are you familiar with the bullish and bearish breakaway formations?
If not, be sure to keep reading. This article will teach you to recognize, interpret, and trade the breakaway candlestick pattern.
 Table of Contents
What is the Breakaway Candlestick Pattern?
Breakaway patterns are multi-candle formations found on Japanese candlestick charts that suggest a market reversal may be in the offing. An actual breakaway is a five-candlestick formation that occurs in either an upward or downward trend.
Although the breakaway is a rare chart pattern, it is still a powerful sign of shifting market sentiment. When it occurs, many forex traders view it as a way to capitalize on a reversal in trend direction. For that reason, the breakaway is considered by many as one of the advanced chart patterns.
How to Identify and Use the Breakaway Pattern in Trading?
As a reversal indicator, breakaway candlestick patterns develop during trending markets. The chart below illustrates the design and its strategic value in the live market.
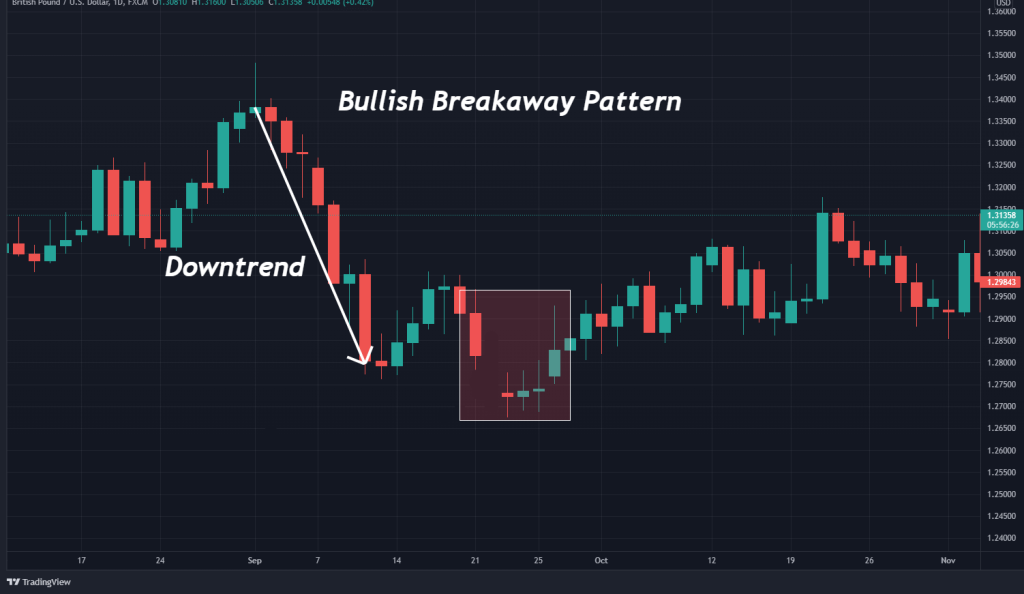
Here is how the bullish breakaway is utilized:
- A pronounced downtrend is recognized.
- The breakaway is constructed. It consists of the following:
- A large, bearish first candle
- A price gap
- A group of three compressed candles
- A large bullish fifth candlestick
- A buy entry is secured above the fifth candle.
Recognition
Recognizing the breakaway pattern quickly is the key to trading it successfully. To do so, be aware of its unique appearance:
- The formation may develop in either a bullish or bearish trend.
- Breakaway patterns begin with a large bearish, or bullish candlestick.
- A gap between the first candle and the second candle occurs.
- The second candle, third candle, and fourth candle have small bodies and minimal shadows.
- The fifth candle is a significant positive or negative candlestick that runs counter to the trend.
No doubt, breakaway patterns are rare. Nonetheless, they rank among the strongest buying and selling signals visible on candlestick charts.
The Bullish Breakaway Candlestick Pattern
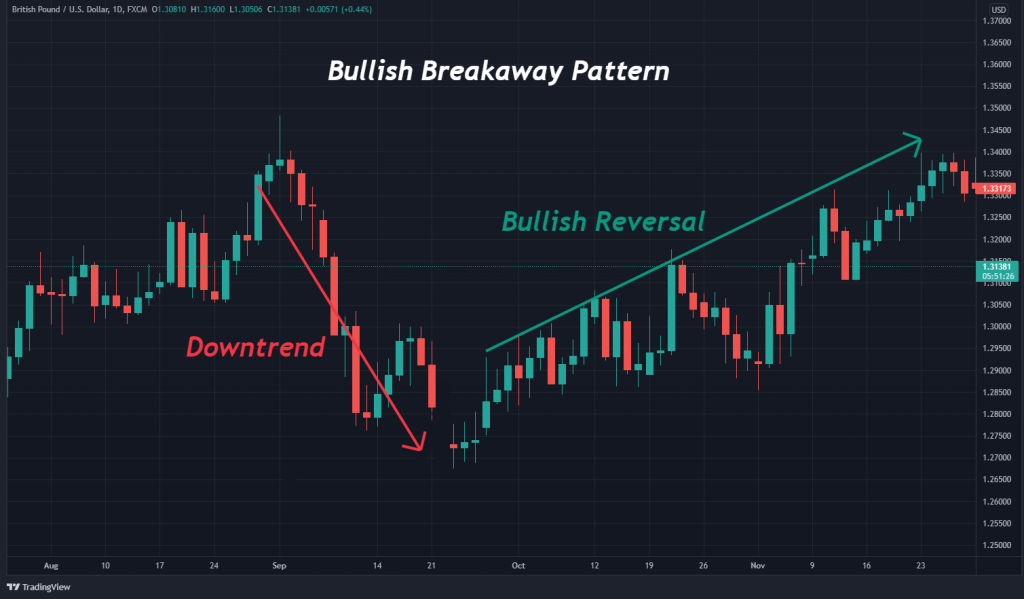
The bullish breakaway occurs during a pronounced drop in price. It is a buying signal that suggests a reversal of a bearish trend.
A bullish breakaway pattern suggests that a new long position is warranted. Below is a picture of this candlestick pattern.
The Bearish Breakaway Candlestick Pattern
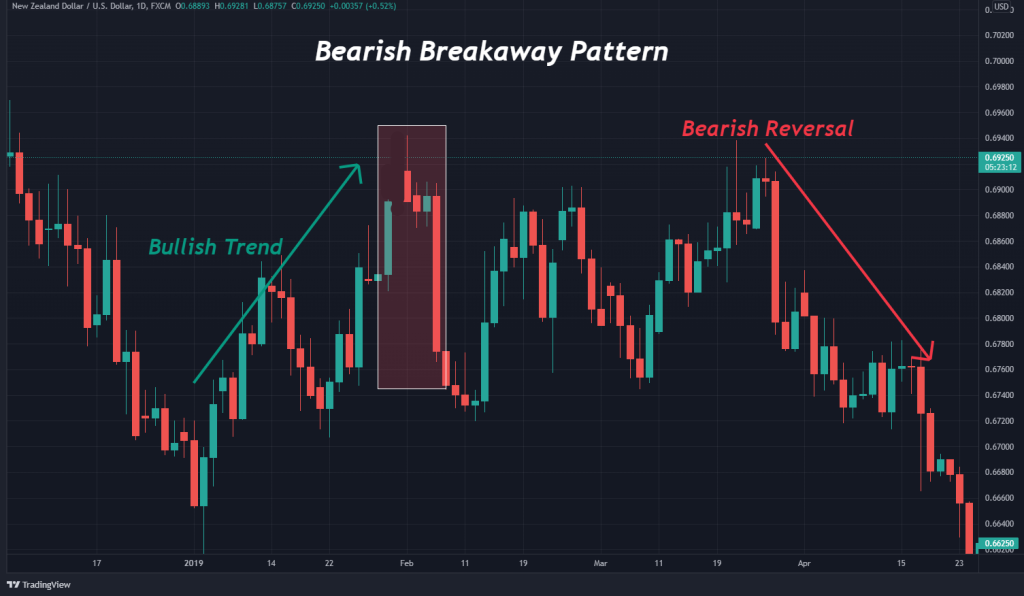
The bearish breakaway develops amid a discernable uptrend in price. This formation suggests that a market reversal may be pending and that a bearish price swing is in the offing.
The bearish breakaway pattern is a signal to sell the market. Below is an illustration of this formation.
How to Trade the Breakaway Pattern (Trading Strategy)
For legions of technical traders, candlestick patterns are a go-to methodology. And like all other chart patterns, there’s a specific way of trading bullish and bearish breakaways.
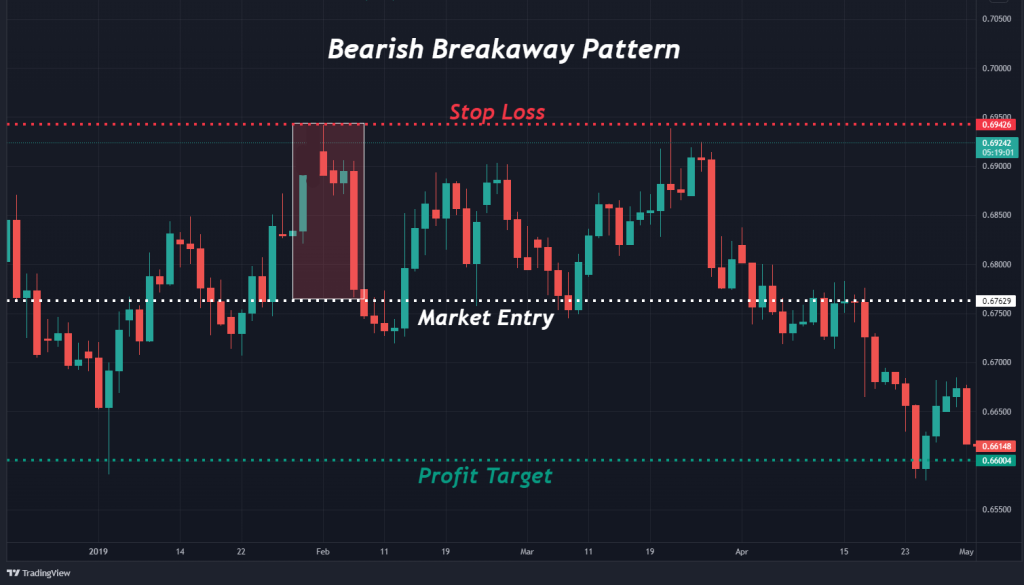
First, one locates a market entry point. Then, stop losses and profit targets are placed, ensuring a positive expectation trade is developed.
1. Market Entry
With the breakaway pattern, locating market entry is reasonably straightforward. After the fifth candle forms, one looks to buy or sell against the trend. This is done as follows:
Bullish Breakaway: The bullish breakaway furnishes the trader with an opportunity to go long in an oversold market. Market entry is a buy order above the fifth candlestick.
Bearish Breakaway: The bearish breakaway pattern aids the trader in shorting an overbought market. Market entry is a sell order below the fifth candlestick.
2. Stop Loss
One of the best things about chart patterns is that they afford the trader a finite stop loss location. In the case of breakaways, stop losses are located according to the pattern’s upper or lower extreme:
Bullish Breakaway: The stop loss is a sell order for the bullish breakaway. It is placed beneath the lower bounds of the formation.
Bearish Breakaway: The stop loss is a buy order for the bearish breakaway. It is placed beneath the upper bounds of the formation.
3. Profit Targets
There are many ways to locate profit targets in forex, futures, and shares trading. Technical levels, pattern height, standard risk vs. reward ratios, and using moving average crossovers are several of the most common. Profit targets for breakaways are set as follows:
- Bullish Breakaway: A bullish breakaway is a buy signal. Thus profit targets are located above the pattern.
- Bearish Breakaway: A bearish breakaway is a sell signal. Thus profit targets are located beneath the pattern.
When setting profit targets for breakaways, it’s important to remember that they are reversal indicators. So, a minimum risk vs. reward ratio of 1:2 is appropriate. Further, it’s advisable to use the BCR methodology as another trading method to confirm the reversal.
Here’s an example of the breakaway chart pattern:
Bullish and bearish breakaway patterns are easily recognized in the live market. However, they are rare! The following chart gives us a comprehensive view of trading this hard-to-find pattern.
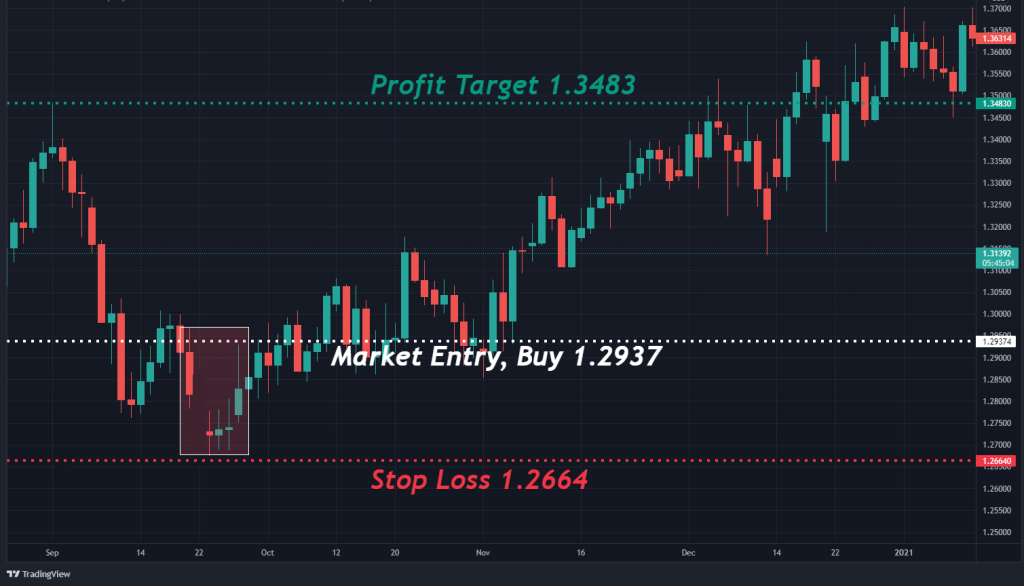
Here’s how the trade above was executed:
- A pronounced bearish trend was identified.
- The bullish breakaway pattern was constructed.
- Buy order was placed above the fifth candle at 1.2937.
- A stop loss was placed beneath the pattern’s lower extreme at 1.2664.
- The trade’s profit target was placed at 1.3483 according to a 1:2 risk vs. reward.
- Upon the profit target being hit, a gain of 546 pips was realized.
The Breakaway Chart Pattern – Pros and Cons
Pros
- Easy to spot in the live market
- Can generate significant profits by calling market tops and bottoms
- Simple to trade
Cons
- Occurs infrequently
- It is expensive to trade on larger timeframes
- May generate false signals in choppy trading conditions
Key Takeaways
In conclusion, here are the key takeaways:
 Key Points to Take Away
- The breakaway candlestick pattern is a reversal indicator that occurs during upward or downward trending markets. There are two types of breakaways: bullish and bearish.
- Breakaway formations are subject to the following progression: a large positive or negative candle, price gap, three small Doji type candles, a large countertrend positive or negative candlestick
- Breakaways are exceedingly rare! They are most commonly found on daily stock charts as pricing gaps are more likely to occur due to session closes.
Frequently Asked Questions (FAQs)
Here are three of the most frequently asked questions regarding breakaway patterns.
Is it possible to make a living strictly from trading chart patterns such as breakaways?
While nothing is “impossible,” trading only breakaways is a tall order. These patterns are sporadic. Thus it is not likely to provide enough trading opportunities to generate consistent revenues.
Do candles two through four need to be Dojis for the pattern to be valid?
No. These candles only need to have small bodies and condensed shadows, as found in spinning tops.
Why do breakaways develop so infrequently on the forex?
Forex is a deep market that trades continuously on a 24-5 basis. Given the robust liquidity and lack of a traditional daily close, price gaps are difficult to come by.
Risk Disclosure: The information provided in this article is not intended to give financial advice, recommend investments, guarantee profits, or shield you from losses. Our content is only for informational purposes and to help you understand the risks and complexity of these markets by providing objective analysis. Before trading, carefully consider your experience, financial goals, and risk tolerance. Trading involves significant potential for financial loss and isn't suitable for everyone.


