


Are you interested in making chart patterns a part of your trading plan? If so, be sure to check out the bull flag pattern.
The “bull flag” or “bullish flag pattern” is a powerful indicator for trading uptrends or topside market breakouts.
Read on to learn more about the bull flag and its use in your financial markets trading.
What is the Bull Flag Pattern?
A bull flag chart pattern is a continuation pattern that occurs in a strong uptrend. It signals that the prevailing vertical trend may be in the process of extending its range. Bull flags are the opposite of bear flags, which form amid a concerted downtrend.
Bullish flags are present in all markets in all time frames. Traders interpret the formation to signal that a an asset may be headed higher. Thus, long-side or buy strategies are appropriate to capture market share.
On the other hand, a bull flag may be viewed as a trade management device for closing out existing short positions.
How to Identify and Use the Bull Flag Pattern in Trading?
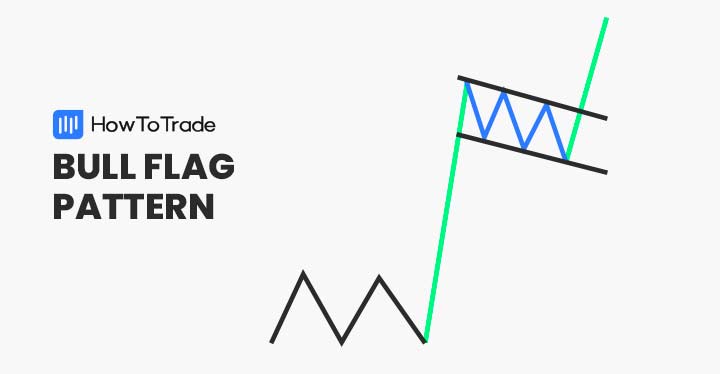
The bull flag pattern is named such because of its appearance. And, this appearance makes it a user-friendly, easy-to-identify chart pattern.
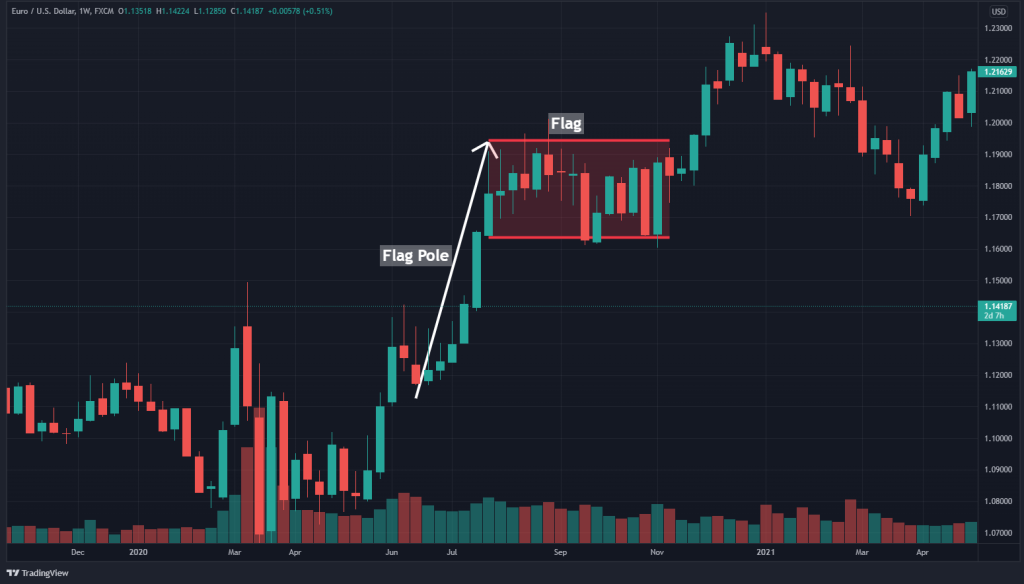
The bull flag consists of two parts: the flag and the flag pole. The flag pole is a pronounced uptrend; the flag is a period of market consolidation that follows the flag pole.
If you observe the EUR/USD chart below, you can see each formation part.
One of the best things about bullish flag patterns is that they are user-friendly. Follow the steps below, and you can quickly integrate the bull flag into your financial markets trading:
- Identify an evolving uptrend in an FX pair.
- Use a trend line and draw the vertical flag pole.
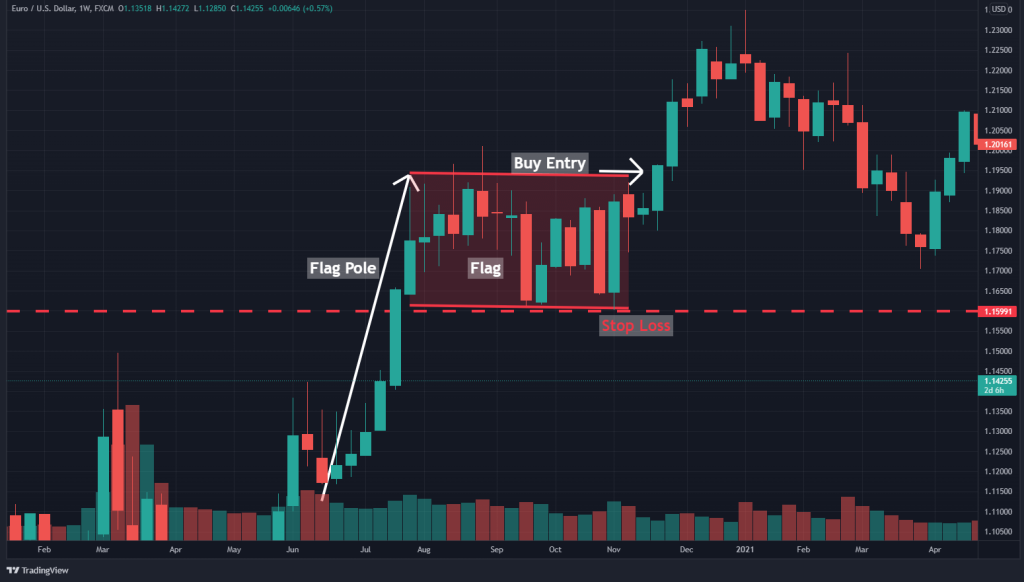
- Use a channel, parallel lines, or separate horizontal lines to draw the flag.
- Place a buy order immediately above the flag’s upper line.
- Place a stop-loss order immediately below the flag’s lower line.
How to Trade the Bullish Flag Pattern?
Now that you are familiar with bull flag patterns let’s get acquainted with a few trading strategies. Below we will cover two basic attack plans: the breakout and pullback strategies.
Before we get started, it’s important to emphasize that bull flag patterns apply to uptrends. So, our trading strategies are designed to engage the “buy” or “long” side of the market. This objective is the polar opposite of what bearish flags suggest.
1. Bull Flag Breakout
A breakout strategy aims to capitalize on a sudden, definitive move in price action. In the case of the bullish flag formation, this means that we are looking to buy into the market in anticipation of a robust extension of the existing uptrend.
This is the opposite of a bear flag pattern, which focuses on downtrends. As a general rule, breakouts are most effective when accompanied by an uptick in traded volumes.
To catch a bullish breakout, we will first spot a bull flag. Upon the flag forming a significant multi-candle consolidation phase, an entry point is located above the upper bounds of the flag. After an increase in volume is confirmed, a buy order is placed above the flag.
From a risk/reward perspective, a ratio of at least 1:1 is recommended for the bullish flag breakout strategy. Accordingly, your profit target price will be at least the range of the flag.
However, larger ratios such as 1:2, 1:3, or 1:4 are viable options when trading trend continuation patterns on larger time frames.
2. Bull Flag Pullback
Typically, the flag portion of the bullish flag pattern doesn’t move perfectly horizontally. It frequently pulls back from the high point of the flag pole. If this is the case, buying a pullback can boost the trade’s potential profitability.
To buy a pullback using bull flags, it’s a good idea to incorporate another technical analysis tool. A great one for this task is the Fibonacci retracement. If a bullish flag coincides with a Fibonacci retracement level, buying the market may be a good idea.
How to Measure a Bull Flag Profit Target?
The flagpole of the bull flag is usually what we use in measuring the profit target of the pattern. For instance, if the flagpole is 10 pips long, that same distance from your entry is what you’ll use as your profit target.
Of course, as we mentioned earlier, you could use the Fibonacci extension lines or simply rely on basic Risk to Reward ratios.
How Accurate is a Bull Flag Pattern?
Although flags are very simple classical chart patterns, they provide an extremely accurate prediction of the next price movement. Therefore, the bull flag pattern tends to be highly accurate.

As you can see in the chart above, the 38% Fibonacci level coincides with the bull flag pattern. In this case, one can buy above the 38% level and get in on the prevailing uptrend.
What are the Bull Flag Pattern Pros and Cons?
Like any other technical indicator, the bullish flag pattern has a collection of unique advantages and disadvantages. Let’s take a look at a few of the most important.
Pros
- Simple to identify
- Prevalent on every time frame and on all financial markets
- A reliable way to trade uptrends
- Furnishes traders with concrete market entry/exit points
Cons
- Flag length is open for interpretation
- May conflict with other technical analysis tools, specifically reversal indicators
- Trading volumes can be erratic, undermining market entry
Everything About the Bull Flag Pattern in One Video
You can check this bite-size video by our trading analysts on how to identify and trade the bull flag pattern.
Key Takeaways
To sum up, here are the key points to keep in mind about the bullish flag pattern:
- The bullish flag pattern frequently occurs on every financial markets time frame. It is the opposite of the bearish flag pattern.
- Bullish flags signal the continuation of a preceding uptrend.
- The pattern may be used to buy bullish breakouts or trade the pullbacks of uptrends.
- Other technical analysis tools can be used in conjunction with bull flags. One example is Fibonacci retracements.
Similar Chart Patterns to the Bull Flag Pattern
Risk Disclosure: The information provided in this article is not intended to give financial advice, recommend investments, guarantee profits, or shield you from losses. Our content is only for informational purposes and to help you understand the risks and complexity of these markets by providing objective analysis. Before trading, carefully consider your experience, financial goals, and risk tolerance. Trading involves significant potential for financial loss and isn't suitable for everyone.


