Chart patterns are one of the most popular forms of technical analysis. These chart formations help traders predict future price movements and make trading decisions. One extremely reliable chart pattern is the island reversal pattern.
Read on to learn more about this powerful formation.
- What is the Island Reversal candlestick pattern?
- What’s the Psychology Behind Island Reversal Patterns?
- How to Identify and Use the Island Reversal Pattern in Trading?
- What are the Types of the Island Reversal Pattern?
- Island Reversal Pattern Trading Strategy (in 3 Steps)
- The Island Reversal Pattern Trading Example
- The Bullish Island Reversal Vs. The Bearish Island Reversal
- What are the Benefits and Limitations of the Island Reversals Pattern?
- Is the Island Reversal a Reliable Reversal Indicator?
- Which is the Best Timeframe Chart for Trading Island Tops and Bottoms?
- Key Takeaways
What is the Island Reversal Pattern?
An island reversal pattern is a formation where price-action gaps separate a group of candlesticks or bars. As in the name, it is a trend reversal pattern that suggests a bullish or bearish trend may be reaching an exhaustion point.
Traders view island reversals as a way to buy or sell in anticipation of prices moving in the opposite direction. In this way, the island reversal pattern may be considered a bullish or bearish indicator.
What’s the Psychology Behind Island Reversal Patterns?
The psychology behind the Island Reversal pattern involves shifts in market sentiment and trader behavior that drive significant price movements. The first gap, which creates one side of the “island,” often reflects a surge in either fear or greed, depending on the direction of the gap. A downward gap might indicate panic selling, while an upward gap suggests excessive optimism.
The period of consolidation after the initial gap can be seen as a period of indecision or uncertainty. Traders are trying to assess the implications of the gap and adjust their positions accordingly. The second gap, in the opposite direction of the first, signals a dramatic change in market sentiment. It could be a realization of the overreaction to the initial news or event, or a new piece of information that has completely altered the market’s perception.
How to Identify and Use the Island Reversal Pattern in Trading?
At its core, the island reversal formation suggests that the trajectory of price action is due for a change in course. Accordingly, it is classified as a reversal indicator.
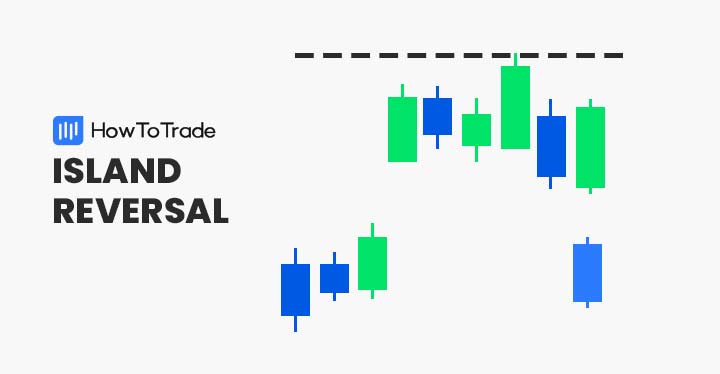
Recognizing island reversals in the live market is straightforward and intuitive. Each formation consists of two parts: a gap zone and an island.
- Gap: A series of two price gaps separate the island from the preceding trend. The first gap is the initial break between the island and price action; the second gap is the final break between the island and price action.
- Island: An island is a group of price bars or candlesticks opposite the first and second gap. It may appear in bullish or bearish trends and is viewed as a harbinger of market reversal.
As you can see, as the name implies, the pattern creates sort of an isolated island on a price chart, which makes this pattern relatively easy to recognize.
What are the Types of the Island Reversal Pattern?
Island reversals come in two types: bullish and bearish.
1. Bullish Island Reversal Pattern
The bullish island reversal pattern develops within a pronounced downtrend. It consists of a negative gap between price action and an island of candlesticks. The bullish island is a signal to buy in anticipation of an upward shift in price action.
The chart below gives us a detailed view of the bullish island pattern.

2. Bearish Island Reversal Pattern
The bearish island reversal pattern forms amid a prevailing uptrend in price. It comprises a positive gap between price action and an island of candlesticks. The bearish island is a signal to sell the market in the hopes of cashing in on a bullish trend reversal.
The chart below gives us a good look at the island reversal bearish pattern.

Island Reversal Pattern Trading Strategy (in 3 Steps)
Using the island reversal formation to trade is a straightforward process. Upon identifying the pattern, all you need to do is determine market entry, locate your stop loss, and align your profit targets. Then, the rest becomes routine. Let’s see how one should trade the island reversal candlestick pattern with an example from the Tesla stock chart on the 15-minute timeframe:
1. Market Entry
With island reversals, there are two ways to enter the market:
- Long: The bullish island reversal offers the trader a buying opportunity. Market entry is a buy order above the formation.
- Short: The bearish island reversal offers the trader a selling opportunity. Market entry is a sell order below the formation.
In bullish and bearish island reversal examples, market entry occurs after the gap zone remains intact.

Our Tesla trading example is a bullish Island Reversal pattern, and we buy as soon as the pattern gets confirmed.
2. Stop Loss
Determining the location of stop-loss orders is straightforward with island reversals:
- Bullish: The island bottom formation has a stop-loss beneath the lower extreme of the pattern.
- Bearish: The island top formation has a stop-loss beneath the upper extreme of the pattern.
Island reversals indicate a forthcoming change in market direction. Thus, the stop-loss order opposes market entry.
In our example, the stop loss sits below the lowest candle on the island.
3. Profit Target Location
As with all forms of technical analysis, there’s more than one way to set a profit target with island reversals. Acceptable alternatives are risk vs. reward ratios or established support and resistance levels.
One of the most common is to aim for a take profit of a minimum of the pattern’s height, which makes it a 1:1 risk-to-reward ratio. An island’s height is the distance between the upper and lower extremes plus the gap. If you tighten your stop loss to just below the gap in a bullish scenario and just above in a bearish scenario, you can get an even better risk-to-reward ratio. That is what we do in our trading example.

We also targeted a gap from recent price action that was yet to be filled. The image below is how the trade turned out:

A renowned chart pattern analysis expert, Thomas Bulkowski, was said to place the accuracy of the pattern at 58%. And while we haven’t confirmed that ourselves, you can do your backtest and see what accuracy figures you come up with.
Just remember that there’s no 100% accurate chart pattern. And you can increase your likelihood of winning by adding other trading indicators and technical analysis tools for extra confluence.
The Island Reversal Pattern Trading Example
The best way to understand how to trade island tops and bottoms is to examine a few island reversal examples detailed on price charts.
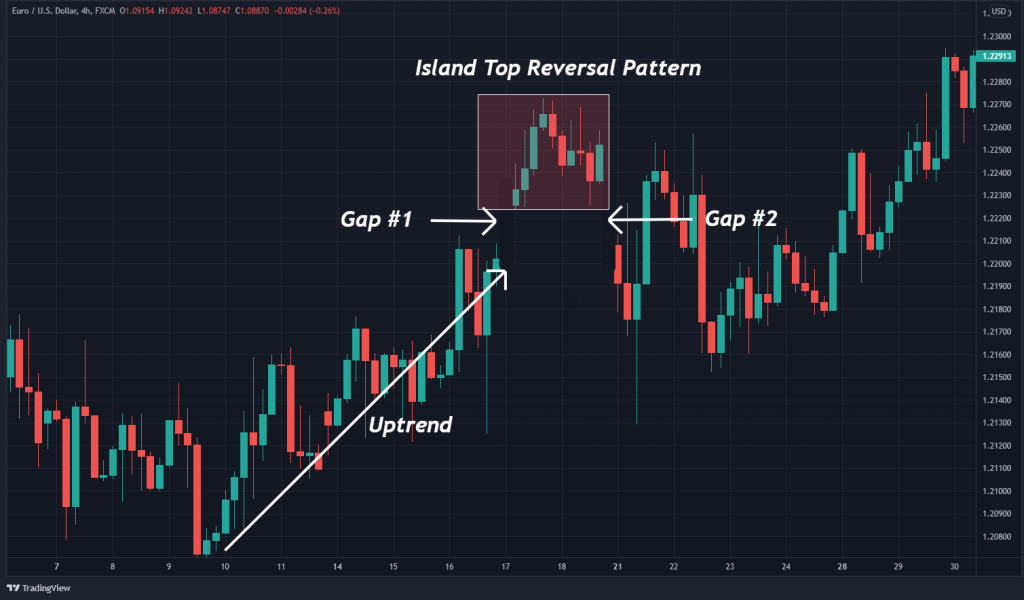
Below is a look at a bearish island trade in the EUR/USD.

This EUR/USD trade was executed as follows:
- An uptrend and island were identified.
- A sell order was placed beneath the gap at 1.2211.
- A stop loss was placed above the island at 1.2273.
- The profit target was 1.2148, adhering to a 1:1 ratio with the pattern’s height.
- Upon the profit target being hit, a 62 pip profit was realized.
The Bullish Island Reversal Vs. The Bearish Island Reversal
There are two types of island reversal formations in trading: bullish and bearish. Below are the key differences between each iteration of the island reversal.
- A bullish island forms during a pronounced downtrend in price.
- A bearish island develops during a defined uptrend in price.
- The bullish island reversal is a signal to buy the market.
- The bearish island reversal is a signal to sell the market.
What are the Benefits and Limitations of the Island Reversals Pattern?
The most common pros and cons of trading the island reversals pattern:
Pros
- Easy to recognize in the live market
- Can produce lucrative reversal trading signals
- Occurs in all FX pairs, commodities, and shares
Cons
- Somewhat rare on shorter timeframes
- It is expensive to trade on weekly, daily chart durations
- A significant variance may be experienced on market entry
Is the Island Reversal a Reliable Reversal Indicator?
Generally, any chart pattern, such as the island reversal or the breakaway pattern, that involves gap trading is considered reliable. However, no chart pattern is infallible. When trading islands, be sure to implement proper risk management parameters.
Which is the Best Timeframe Chart for Trading Island Tops and Bottoms?
The best timeframe for trading the Island pattern is dependent on you. Traditionally, stock traders have used islands within the context of a daily chart, but there are no steadfast rules in this area. You can certainly use the island reversal pattern in shorter time frames of 1H, 15M, and even 5M.
Key Takeaways
In conclusion, here are the key takeaways:
- The island reversal is a pattern that suggests a prevailing trend may be nearing exhaustion. It consists of an initial price gap, a cluster of candles or price bars, and a second price gap
- Island reversals come in two varieties: bullish (buy) and bearish (sell)
- The process for trading an island top or bottom is straightforward. Buy or sell opposite the gap, place a stop-loss beneath or above the island, and assign a minimum profit target of the island’s height
Risk Disclosure: The information provided in this article is not intended to give financial advice, recommend investments, guarantee profits, or shield you from losses. Our content is only for informational purposes and to help you understand the risks and complexity of these markets by providing objective analysis. Before trading, carefully consider your experience, financial goals, and risk tolerance. Trading involves significant potential for financial loss and isn't suitable for everyone.