Are you familiar with channel patterns? How about the descending channel pattern? In this article, we will teach you how to recognize, interpret, and trade this powerful chart formation.
- The Descending Channel Pattern is a bearish chart formation used in technical analysis to identify potential downtrends in the market.
- This pattern is characterized by two parallel, downward-sloping lines defining the lower highs and lower lows of a security’s price movement.
- Traders often use the Descending Channel to strategize short-selling opportunities and to set stop-loss orders, anticipating breakouts or continuations of the trend.
Here is what you can find in this article.
- What is The Descending Channel Pattern?
- How to Identify the Descending Channel Pattern in Trading?
- How to Trade the Descending Channel Pattern – Trading Strategies with Examples
- Descending Channels – Pros And Cons
- What’s the Difference Between the Descending Wedge (Falling Wedge) and the Descending Channel?
- Is the Descending Channel a Reliable Trend-Following Indicator?
- When is the Best Time to Use a Descending Channel?
- I am a Momentum Trader. Will the Descending Channel Work with RSI or Stochastics?
- Key Takeaways
What Is The Descending Channel Pattern?
The descending channel pattern (also called the falling channel) is a bearish chart formation. It develops within pronounced downtrends in asset pricing.
Forex traders view descending channels as evidence of weakened strength in the counter currency. Accordingly, it is frequently used to sell a currency pair and join the prevailing market downtrend.
It appears as two parallel lines in a downward trend, forming resistance and support levels for the price. The upper boundary is formed by connecting the lower highs, while the lower boundary comes from connecting the lower lows.
The descending channel is strictly a bearish chart formation. But it has a bullish alternative called the ascending channel, where everything is completely opposite.
How To Identify the Descending Channel Pattern in Trading?
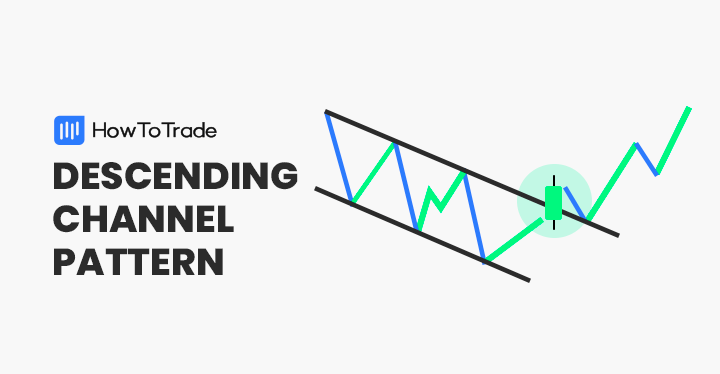
One of the biggest advantages of the descending channel chart pattern is its appearance. The pattern is readily discernable and consists of three parts: an upper channel line, a lower channel line, and a price channel.
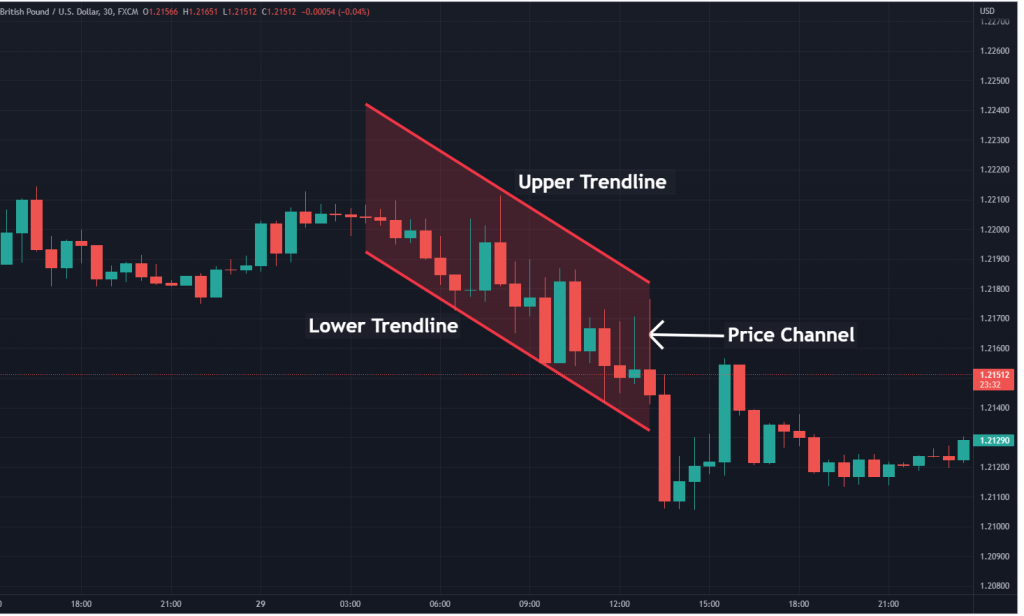
Upper Channel Line
The upper channel line connects the upper bounds of price action. Essentially, it is an upper trend line that defines the top of a periodic trading range.
The upper channel line slopes downward. It represents a collection of lower highs, which indicates that a series of incremental price drops has taken place.
Lower Channel Line
The lower channel line connects the lower bounds of price action. It is a lower trend line that defines the bottom of a periodic trading range.
Like the upper line, the lower channel line slopes downward. It connects a series of lower lows and indicates an ongoing bearish trend.
Price Channel
The area between the upper channel line and the lower channel line is known as the price channel. It represents a series of price bars encapsulated by two parallel lines.
For the descending channel pattern, the price channel consists of a trading range that falls between parallel trend lines. Bearish price action is evident as the channel itself exhibits a downward trajectory. Due to these characteristics, the price channel is a bearish channel.
How To Trade the Descending Channel Patterns – Trading Strategies with Examples
Descending channels furnish the trader with a multitude of strategic options. Two of the most common are trend following and reversal breakout approaches.
Trend Following
As in the name, the descending channel suggests that a downtrend in price is evident. Thus, it can be a viable sell signal or queue to short the market with the prevailing trend. Because the trade is with the trend, a greater risk vs reward ratio may be applied.
To execute this strategy competently, you must use the channel to identify an optimal trade location. By entering a sell order from the upper bounds of the channel, one can secure short-side market exposure.
Trend Following Example
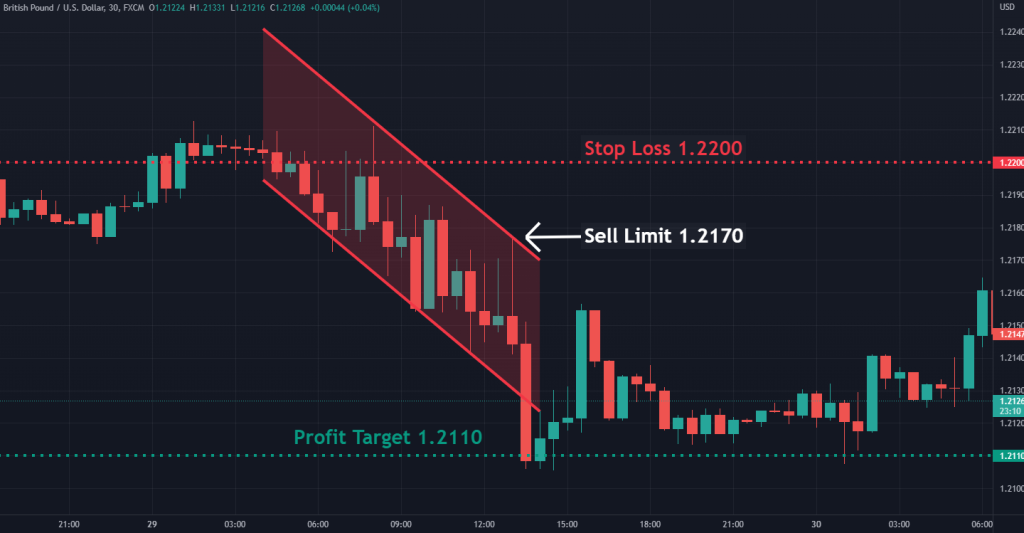
The GBP/USD chart above gives us a clear example of how to use the descending channel to short a market. Here is the process:
- Identify and draw the channel.
- Enter a sell limit order from just beneath the upper trend line at 1.2170.
- Place a stop-loss order above the upper trend line at 1.2200.
- Locate a profit target order at 1.2110 according to a 1:2 risk vs reward ratio.
- Upon the profit target being hit, a 60-pip gain is realized.
- Know, though, that there’s the chance that the price triggers your limit order and continues its upward push to create a breakout and clear out your stop loss. That’s why you should put proper risk management in place.
Reversal Breakout
Contrary to trend-following strategies, descending channels may also be used to project a shift in a prevailing bearish trend. This is done by waiting to buy the market on price breaks above the channel’s upper extreme.
To trade reversal breakouts, you buy the market above the upper trend line. In doing so, a new long position is opened. Stop-loss orders are placed beneath the channel, and profit targets are located above the channel.
Reversal Breakout Example

The GBP/USD chart above illustrates the functionality of a reversal breakout trade. Below is the process by which this strategy is executed:
- Identify and draw the descending channel.
- Place a buy-stop or stop-limit order above the upper trendline at 1.2270.
- Locate a stop-loss order beneath the channel at 1.2237.
- Set a profit target above the channel at 1.2301, adhering to a slightly sub-1:1 risk vs reward ratio.
- Upon the profit target being hit, a 31-pip profit is realized.
Another way to trade the reversal breakout strategy is to wait for a bullish candle to close above your upper channel. If you’re feeling more conservative, wait for a breakout followed by a retracement. But don’t forget that there’s always the chance that the breakout was false, and the price simply returns within the channel.
Descending Channels – Pros And Cons
Like any other technical analysis pattern, the descending channel has a collection of distinct pros and cons. Below are a few of the most important.
Pros
- Trend following strategies that implement descending channels can produce large sell-side profits. If a bearish trend is strong, forex traders can ride the channel for hundreds of pips.
- The pattern is evident in every market on every time frame. This is ideal for traders seeking an abundance of trade setups.
- Descending channels gives the trader strategic flexibility. They may be used to follow trends, trade breakouts, or identify reversals.
Cons
- On large timeframes, channels can be wide. Due to the wide channel, stop loss locations can be distant, making trades expensive to execute.
- The pattern features reduced efficacy on shorter timeframes.
- During periods of market consolidation, descending channels have a tendency to produce false signals.
- There’s a chance of a false breakout on either side of the channel.
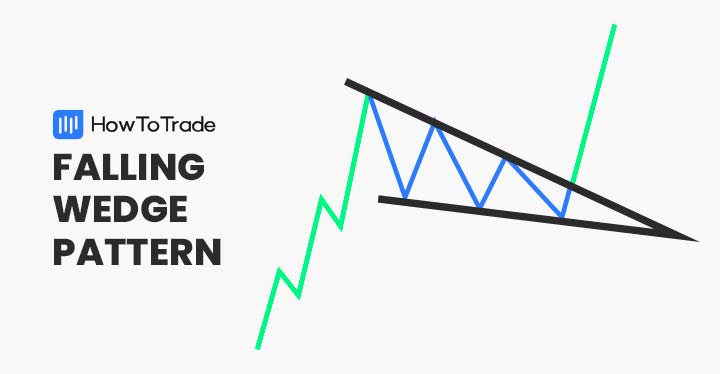
What’s the Difference Between the Descending Wedge (Falling Wedge) and the Descending Channel?
While both descending channels and wedges depict downward price movement, their trendline behavior and implications differ. Descending channels appear as the price oscillating between two parallel trendlines, signifying a continuation of the downtrend. Conversely, descending wedges feature converging trendlines, with highs and lows getting closer. This convergence suggests a potential trend reversal, with a breakout above the upper trendline hinting at an upcoming upward move.
Another difference is in their use. For both patterns, you can trade a breakout to the upside if you get an opportunity. But as you may have already noticed from our example up there, you can also take a trend continuation trade when the price reaches the upper trendline of the channel.
Is the Descending Channel a Reliable Trend-Following Indicator?
The Descending Channel is only as reliable as the trader trading it. It’s a chart pattern because many professional traders have observed a certain reaction when it appears on the chart. However, it’s no holy grail, just like no single indicator or trading tool is. Proper risk management is advised when using the descending channel to trade trends.
When is the Best Time to Use a Descending Channel?
The best time to use the descending channel pattern depends on you and the kind of trader you are. The pattern is fractal, so it appears on all timeframes and all financial charts. It now depends on whether you use it on the intraday charts or the swing chart.
I am a Momentum Trader. Will the Descending Channel Work with RSI or Stochastics?
Descending channels function well with a variety of indicators. This includes momentum oscillators such as RSI and Stochastics. However, we recommend you backtest the pattern with either indicator and both indicators at once. Tweak the settings of the indicators until you find a trading edge, if there’s any.
Here are the key takeaways from trading the Descending Channel pattern.
- The descending channel pattern occurs during a bearish trend in the market. It consists of three parts: an upper trend line, a lower trend line, and a price action channel.
- Descending channels may be traded in many different ways. Two of the most popular are trend-following and breakout reversal strategies.
- Like all other forms of technical analysis, this chart pattern isn’t infallible. In flat markets, it can produce false signals, and evident trends can suddenly fade.
- Within the context of a comprehensive trading plan, descending channels can be a valuable tool for buying or selling a market.
Risk Disclosure: The information provided in this article is not intended to give financial advice, recommend investments, guarantee profits, or shield you from losses. Our content is only for informational purposes and to help you understand the risks and complexity of these markets by providing objective analysis. Before trading, carefully consider your experience, financial goals, and risk tolerance. Trading involves significant potential for financial loss and isn't suitable for everyone.