The head and shoulders is a bearish candlestick pattern that occurs at the end of an uptrend and indicates a trend reversal. It is considered a reliable and accurate chart pattern and is often used by traders and investors to predict future price movements.
- In this article you will learn the critical features of the Head and Shoulders pattern, including the left shoulder, head, right shoulder, and neckline, and discover step-by-step instructions on how to accurately identify and execute trades based on this pattern
- We will explore essential tools and technical indicators that can enhance the effectiveness of the Head and Shoulders pattern in your trading strategy, helping you to make informed decisions and manage risk effectively.
- Why the head and shoulders patterns are statistically the most accurate of the price action patterns, reaching their projected target between 80% and 90%.
In this article, we are going to show you how to identify and use the head and shoulders pattern. We’ll also show you the essential tools and technical indicators to combine when using this pattern as a trading strategy.
What is the Head and Shoulders Pattern?
The bearish head and shoulder pattern is a famous classical charting formation in technical analysis that appears at the end of an uptrend and signals that the previous trend may come to an end. Forex traders often use it as an indicator to enter a short-selling position or exit a long-position trade.
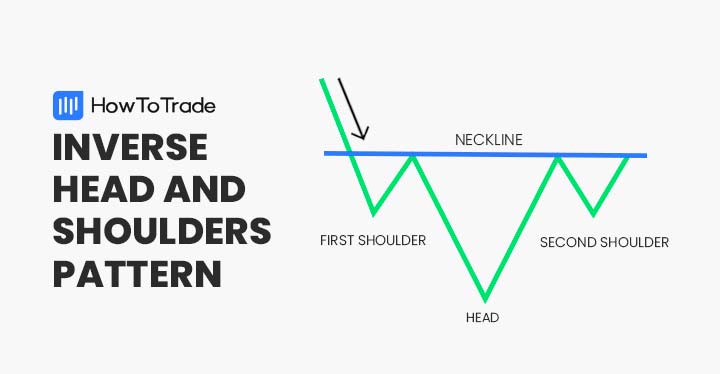
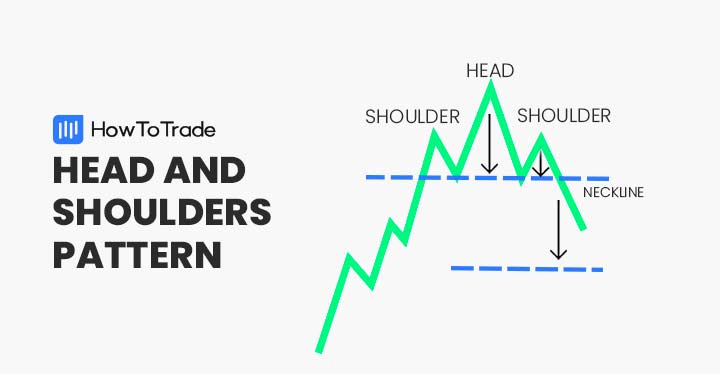
Much like the inverse head and shoulders pattern, the head and shoulders pattern is characterized by three tops that form the shape of the head in the middle and two shoulders – the left shoulder and the right shoulder. Also, it has a neckline that serves as a support level.
In its appearance, it has a similar formation and meaning to the double top pattern and the triple top pattern.
How to Identify the Head and Shoulders Pattern in Trading?
There are key features you need to look out for when searching for a head and shoulders pattern on trading charts. First, the pattern normally comes after a bullish uptrend at a period when the buying pressure is losing momentum.
Then, a left shoulder is formed followed by a middle peak higher than the first top. Then another right shoulder is formed at the same level as the first left shoulder (more or less). Finally, the pattern should consist of a clear neckline that is used as a support level.
Taking the above into account, let’s see how the head and shoulders pattern looks on a trading chart.
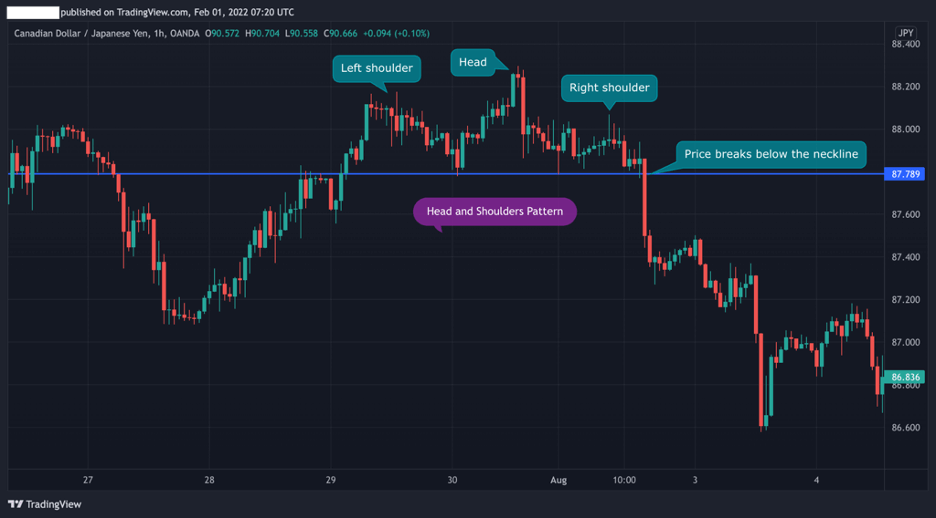
As seen in the CAD/JPY 1H chart above, the head and shoulders candle pattern occurs at the end of an uptrend and has all the elements that help us identify the pattern.
Based on the logic of this pattern – as soon as the price falls below the neckline, a trader will enter a short-selling position with a stop-loss order at the highest level of the right shoulder.
In summary, to identify and trade the head and shoulders pattern, we suggest you follow the steps below:
- Identify three top levels after an uptrend that include left shoulder, head, and right shoulder
- Find the neckline support level
- Wait for the breakout to occur and place a selling order once a candle closes below the neckline. It’s best to use Fibonacci retracement levels as a confirmation tool.
- Set a stop-loss order above the neckline (preferably at the highest level of the right shoulder) and use a risk-reward ratio
How to Trade the Head and Shoulders Pattern?
The head and shoulders candle pattern is essentially the same as the inverse head and shoulders pattern (also called the head and shoulders bottom) but in the other direction. This means that the target of a trader is to find the perfect entry-level to enter a short-selling position (or closing an existing long position).
To do so, we are going to show you how to trade the breakout once you identify the head and shoulders pattern and how to use Fibonacci retracement levels as another confirmation tool.
1. Trading the Breakout
Breakout trading is a trading technique that involves the buying and selling of assets when the price breaks above or below a certain level. It can be used in many different charting patterns and with the help of various technical indicators.
The good thing about the head and shoulders formation is that it’s easy to identify the neckline, which helps you find the ideal breakout entry level. Therefore, some traders will be looking to enter a position immediately after the price falls below the neckline.
In the example below, we can see how the CAD/JPY pair’s exchange rate dropped when the breakout occurred and a new bearish trend started.

The reason why many traders prefer to trade the breakout (without any additional tools) is that they do not want to miss the drop that usually occurs following the breakout. In other words, FOMO.
This is especially the case for active day traders or scalpers who are looking for minor price movements and get in and out of positions several times a day.
2. Confirm the Inverse Head and Shoulders Pattern with Fibonacci Levels
While breakout trading is a great method to capture small price movements, there’s a certain risk in using this trading strategy and it is not necessarily suited for all types of traders. For that reason, you should use other tools that will help you to confirm that the breakout is not a false breakout.
Obviously, there are no guarantees in trading, however, using other indicators like Fibonacci levels can significantly increase your chances of success.
In the CAD/JPY chart below, we used the same scenario with Fibonacci retracement levels from the lowest to the highest level of the previous uptrend.

As you can see, the breakout occurs somewhere around the 38.2% Fibonacci level and then once the breakout is confirmed, the trend continues until the 78.6% level (not available in the chart but the trend continues).
Moreover, using Fibonacci levels not only helps you to invalidate the breakout but also assists you in placing stop-loss orders and finding the right profit target.
The Free Head and Shoulders Trading Strategy PDF
If you need something to easily carry around and refer to when it comes to Head and Shoulders trading strategy, this PDF is for you:
The Free Head and Shoulders Trading Strategy PDF
The Head and Shoulders Pattern – Pros and Cons
These are the most common advantages and disadvantages of trading head and shoulders pattern:
Pros
- Very accurate chart pattern
- Due to its structure, the head and shoulders pattern offers a defined entry-level, stop loss, and take profit targets
- Effective when used in combination with Fibonacci levels and other trend reversal indicators
Cons
- Can be mistaken for a continuation of the previous trend rather than starting a new bearish trend
- Not a frequently occurring chart pattern
Key Takeaways
In conclusion, here are the key points you need to know about the head and shoulders chart pattern:
- The head and shoulders is a bearish reversal pattern formed after an upward movement and often signals a major trend reversal
- The pattern consists of three tops – left shoulder, head, and right shoulder. Additionally, it has a neckline support level around the lowest price levels of the two shoulders
- Once identified, a trader will enter a short-selling position when the price breaks below the support neckline
- A stop-loss order should be placed at the highest level of the right shoulder
- It is important to combine the head and shoulders pattern with other technical indicators like Fibonacci support and resistance levels
Head and Shoulders Pattern Frequently Asked Questions
Below are a few of the most frequently asked questions facing the head and shoulders pattern in forex trading.
How do you validate a head and shoulders formation?
The head and shoulders pattern is confirmed at the point of the breakout. This is the level that validates that a new trend might occur and buyers can no longer push prices higher.
How do you draw the head and shoulders chart pattern?
As you can conclude from the examples we presented above, you don’t really need to draw head and shoulder patterns. Instead, all you need to do is identify the pattern and find a clear neckline. Then, it is useful to draw a horizontal line at the neckline level.
How accurate is the head and shoulders pattern?
According to some analysts, the head and shoulders pattern has a success rate of 85%, although these numbers should be taken with a grain of salt. Nonetheless, there’s no doubt that the head and shoulders pattern is among the most accurate and reliable charting patterns in technical analysis.
Risk Disclosure: The information provided in this article is not intended to give financial advice, recommend investments, guarantee profits, or shield you from losses. Our content is only for informational purposes and to help you understand the risks and complexity of these markets by providing objective analysis. Before trading, carefully consider your experience, financial goals, and risk tolerance. Trading involves significant potential for financial loss and isn't suitable for everyone.