Do you want to trade Japanese candlestick patterns? Read on to learn more about one of the most powerful — the engulfing candle.
The engulfing candle is a trend reversal indicator. Engulfing candles come in two types: the bearish engulfing pattern and the bullish engulfing pattern. This article will cover identifying and trading these formations on the financial markets.
What is the Engulfing Candle Pattern?
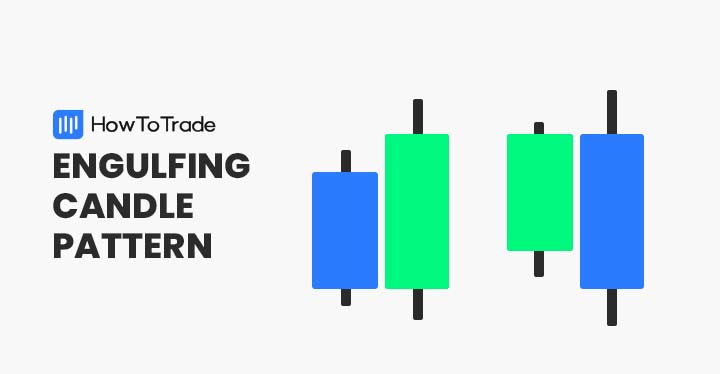
The engulfing candlestick pattern is a chart pattern that signals a possible market reversal. It is a two-candle pattern that may occur in either an uptrend or downtrend on any FX pair and time frame. Engulfing patterns come in two types: bullish and bearish.
Traders use the engulfing candlestick pattern to trade market reversals. It may be viewed as being a precursor to the end of an uptrend or downtrend. In this way, an engulfing candle can be a bearish or bullish pattern.
How to Identify and Use the Engulfing Candle Pattern?
Engulfing candles are easy to identify and trade in real-time. All you need to do is qualify the formation as bullish or bearish and wait for confirmation. Let’s see how you can identify the engulfing candle pattern:
Bullish Engulfing Pattern
The bullish engulfing candlestick pattern occurs when a larger positive candle follows a small negative candle. The body of the positive candle completely covers or “engulfs” the negative candle. A bullish engulfing pattern is pictured below.

This formation occurs amid a downtrend.
Bearish Engulfing Pattern
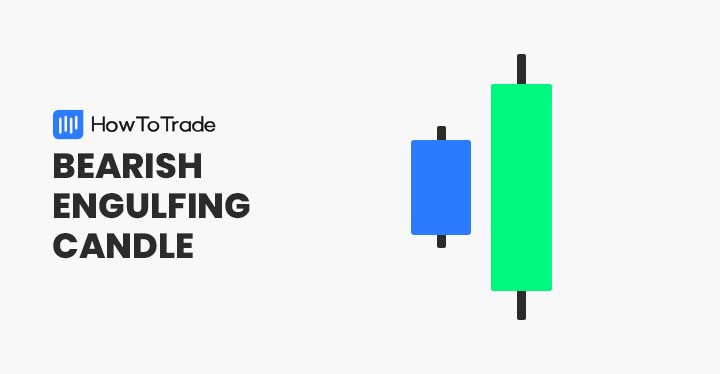
The bearish engulfing pattern is a two-candle formation that occurs when a larger negative candle follows a small positive candle. Thus, the body of the negative candle engulfs the positive one. Below is a picture of this chart pattern.
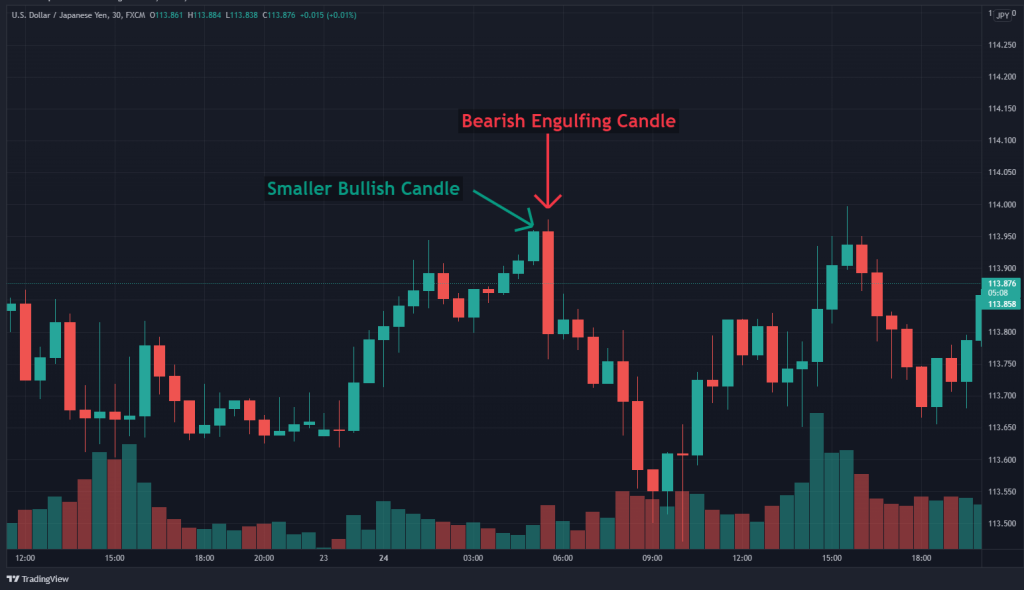
Bearish engulfing candles develop within uptrends.
Confirmation
Confirmation is a term used to describe the price action that confirms a defined candlestick chart pattern. In the case of the bullish engulfing pattern, it is a positive move in price that follows the large positive candle.
For the bearish engulfing pattern, it is a negative move in price that follows the large negative candle.
The chart below illustrates confirmation following the formation of a bullish engulfing pattern.
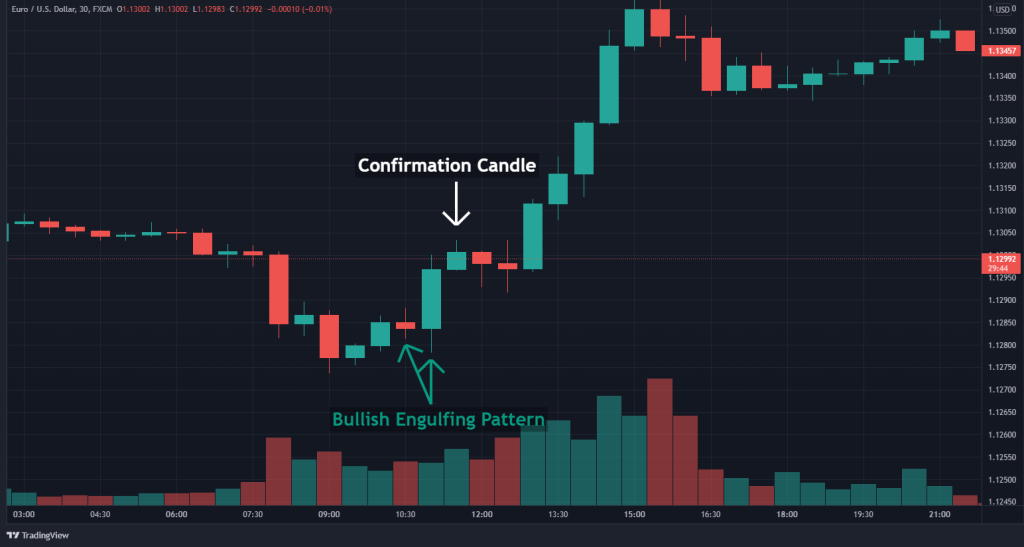
Traders look for confirmation when trading engulfing candles. Confirming candles add confidence to the trade and provide a market entry point.
How to Trade the Engulfing Candle Pattern?
Engulfing candle patterns are generally intuitive, user-friendly indicators. You can apply them to the financial market in three steps.
Step 1: Enter the Market
The first step in trading an engulfing pattern is recognizing the formation in real-time. To do so, look for patterns where a larger opposing second candle follows a smaller positive or negative candlestick.
Once identified, you are ready to enter the market on the next confirmation candle. To open a long position, buy above the bullish engulfing pattern; to open a short position, sell below the bearish engulfing candle.
Step 2: Set Profit Target
Profit targets are orders that reside above or below a trade’s entry price. Upon the second bullish engulfing candle of the pattern forming and market entry defined, a profit target may be set.
Profit targets are located above the buy entry for the bullish engulfing pattern. For bearish engulfing patterns, profit targets are placed beneath the sell entry.
Step 3: Set the Stop Loss
After gaining confirmation of the engulfing pattern, a stop loss may be placed upon the market. Stops are typically located above or below the second candle of the formation.
When the bullish engulfing pattern appears, the stop loss is placed beneath the long positive candle. The stop loss is placed above the elongated negative candle when the bearish engulfing pattern occurs.
Example
To illustrate the trading engulfing candles, refer to the EUR/USD chart below. As you can see, the bullish engulfing candle pattern is present, signaling a possible buying opportunity.
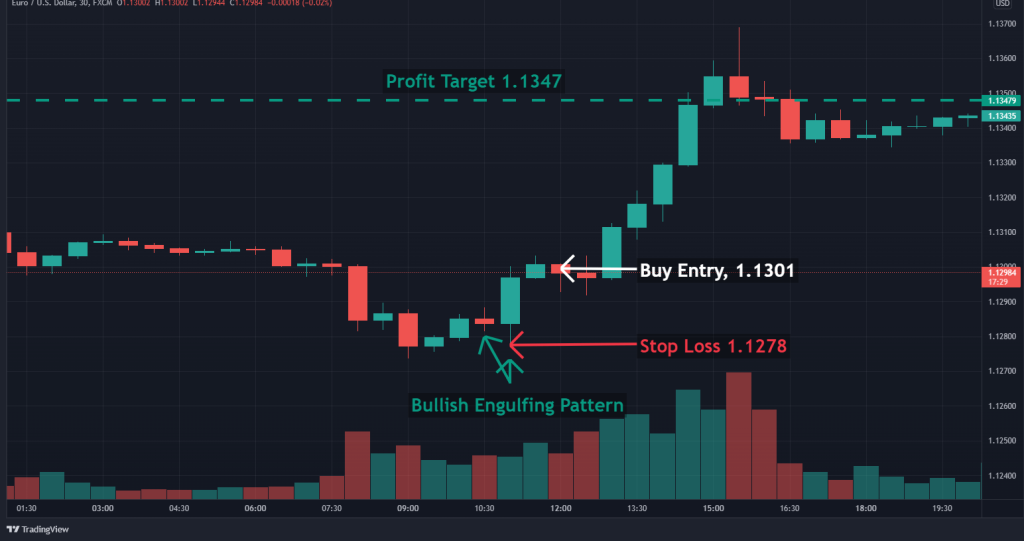
The trade above is executed via the following progression:
- The bullish engulfing pattern is identified.
- A buy is executed at 1.1301 during confirmation.
- A profit target is located at 1.1347, according to a 1:2 risk vs. reward ratio.
- The stop loss is placed at 1.1278 beneath the second bullish candle.
The Engulfing Candle Pattern Trading Strategy PDF
If you need a PDF that describes how to trade the Engulfing Candle Pattern trading strategy, here’s one for you:
The Engulfing Candle Pattern Trading Strategy PDF
The Engulfing Candle Pattern – Pros and Cons
Bullish and bearish engulfing candlestick patterns have a unique set of pros and cons.
Pros
- Engulfing patterns are readily identifiable visually.
- Both bullish and bearish engulfing candlestick patterns frequently occur on all financial market charts, on all time frames.
- Engulfing patterns can be an exceedingly profitable way to trade reversals.
Cons
- Engulfing patterns can produce false bearish or bullish reversal signals.
- On large time frames, stop losses may be extensive.
- Often precede choppy market conditions and consolidation.
Everything About the Engulfing Candle Pattern in One Video
You can check this video by our trading analysts on how to identify and trade the engulfing candle pattern.
Key Takeaways
Here are the key takeaways you need to consider when using the engulfing patterns.
- Engulfing patterns are characterized as reversal indicators.
- Traders use engulfing patterns to trade the reversal of bullish and bearish trends.
- Confirmation lends credence to the formation and is used to enter the market.
- Engulfing patterns aren’t 100% accurate, so proper risk management is required.
Risk Disclosure: The information provided in this article is not intended to give financial advice, recommend investments, guarantee profits, or shield you from losses. Our content is only for informational purposes and to help you understand the risks and complexity of these markets by providing objective analysis. Before trading, carefully consider your experience, financial goals, and risk tolerance. Trading involves significant potential for financial loss and isn't suitable for everyone.