The three white soldiers is a bullish trend reversal candlestick pattern that can help determine future price movements. This article will show you how to identify and trade this pattern. Keep reading to learn more.
- What is the Three White Soldiers candlestick pattern?
- How to identify and use the Three White Soldiers pattern?
- Three White Soldiers Pattern (VIDEO)
- How to trade the Three White Soldiers candlestick pattern?
- The Three White Soldiers pattern – Pros and cons
- Key takeaways
- Frequently asked questions (FAQs)
What is the Three White Soldiers Candlestick Pattern?
The three white soldiers is a bullish candlestick formation seen on candlestick charts that occurs at the bottom of a bearish trend and indicates that the price could soon reverse.
As a triple candlestick pattern, the three white soldiers pattern consists of three consecutive bullish candlesticks at the bottom of a downward trend. Traders interpret this charting formation as an indicator of a price reversal and the end of the selling pressure.
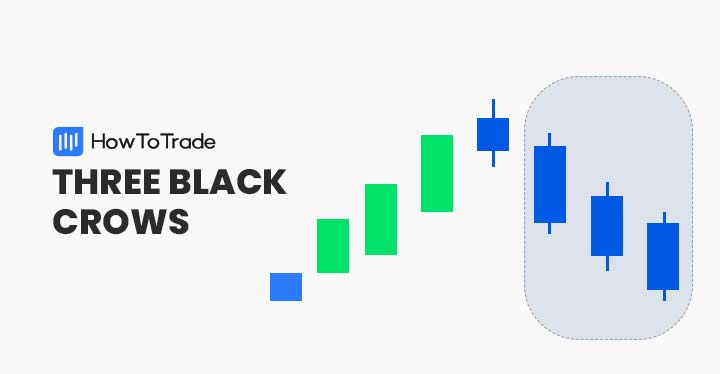
The opposite pattern of the three white soldiers is the three black crows pattern, which is made of three consecutive bearish candles that appear at the top of an uptrend and is, therefore, a bearish trend reversal chart pattern.
How to Identify and Use the Three White Soldiers Pattern?
To identify the three white soldiers candlestick pattern, you need to find three consecutive bullish candles that appear at the bottom of a downtrend.
In addition, each candle must have a relatively long body and opening price above the closing price of the previous candle, ultimately creating a shape of the “V” letter.
Below is an example of the three white soldiers’ pattern on the AUD/USD 1H chart.
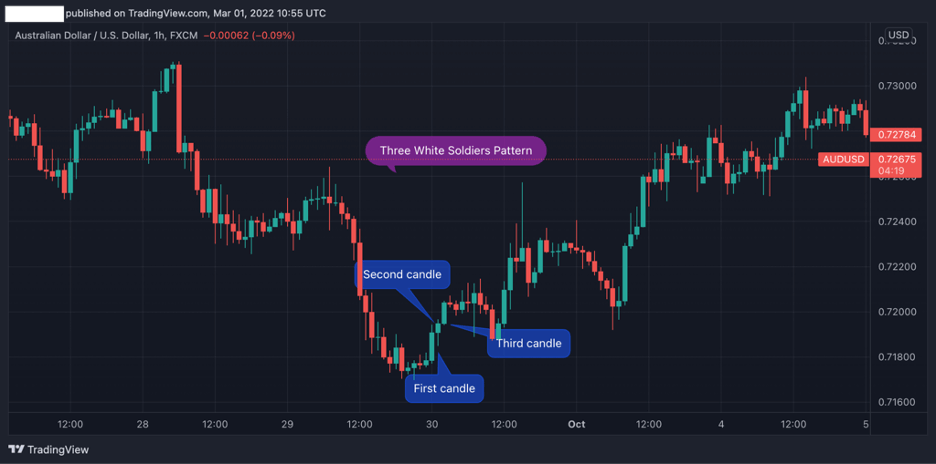
As you can see, the pattern appears at the bottom of a bear market and consists of three bullish candles. Furthermore, each candle has an opening price that is above the previous candle’s closing price, which indicates that the momentum of the prior trend is weakening, and a sharp bullish reversal is likely to occur.
When this happens and you identify the three white soldiers pattern, here are the key steps you need to follow to use and trade it:
- Identify three candles that appear following a downward trend and close one above the other
- Add additional technical analysis tools to confirm the price reversal – RSI, MACD, Stochastic and Fibonacci levels
- Enter a long buying position when the third candle is completed
- Set a stop-loss order below the lowest level of the first candle and set a take profit target at the highest level of the previous trend
Everything About the Three White Soldiers Pattern in One Video
Watch this video to learn how to identify and trade the three white soldiers pattern with real trading example.
How to Trade the Three White Soldiers Candlestick Pattern?
Like many other advanced candlestick chart patterns, the three white soldiers candle pattern on its own might not be sufficient to indicate a trend reversal and enter a buying position.
It, therefore, would be helpful to confirm the pattern with other technical analysis tools. In this section, we will show you two Japanese candlestick charting techniques to confirm a trend reversal.
Using Trend Reversal Indicators – RSI and Stochastic Oscillator
Two of the most effective indicators to confirm trend reversals are the Relative Strength Index (RSI) and the Stochastic oscillator. In essence, these technical analysis tools indicate overbought and oversold areas and thus, may help you to identify a potential reversal zone.
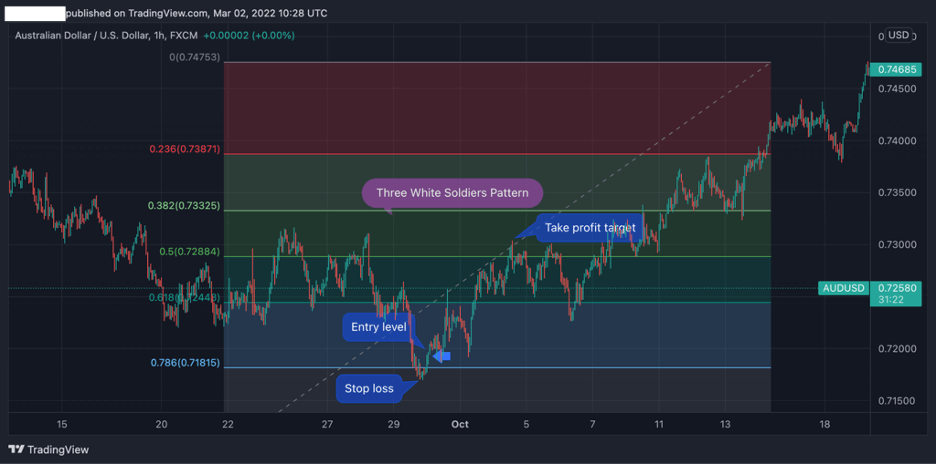
As you can see in the AUD/USD 1H chart below, both RSI and Stochastic oscillator are below the oversold territory at the exact time when the three white soldiers pattern appears (RSI below 30 and Stochastic is below 20). This validates the candlestick pattern and provides an additional signal for an upcoming trend reversal.
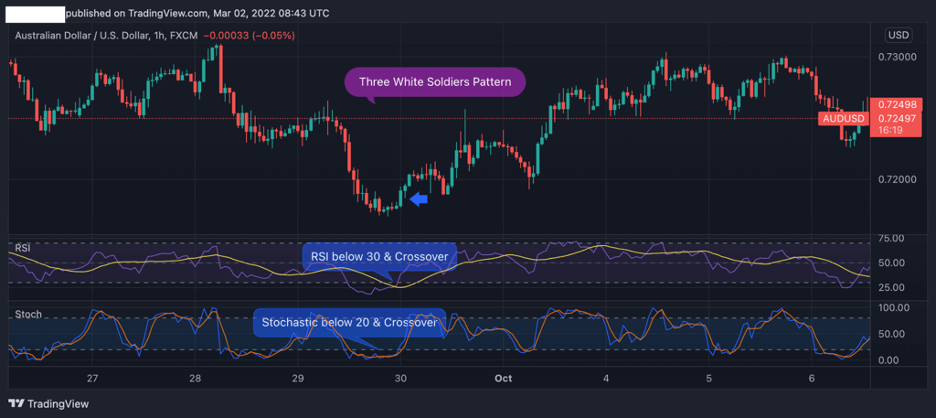
In the above example, a trader will enter a long position when the third bullish candlestick is completed with a stop loss at or below the lowest level of the first candle. Take profit should be placed at the highest level of the previous bearish trend.
Adding Fibonacci Retracement Levels
Besides using trend reversal indicators, you can also use Fibonacci retracement levels to detect possible areas of support or resistance and determine whether a trend reversal is likely to occur.
To draw Fibonacci retracement levels, you need to find a completed trend and drag it from the lowest to the highest level of the prior trend (as seen in the chart below).
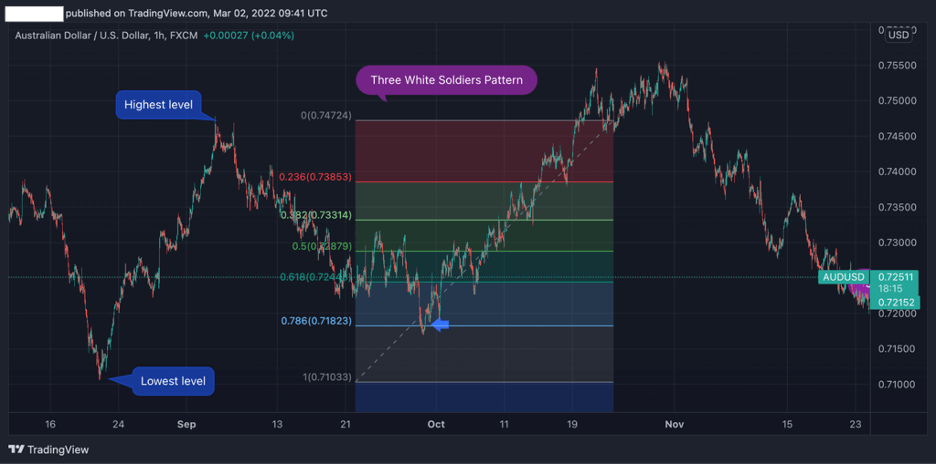
Then, once Fibonacci retracement levels are drawn, you can zoom in and search for a market entry-level. Furthermore, you can use Fibonacci to find a stop loss placement and take profit targets.
Taking the above example, the entry-level would be at the closing price of the third candle (as the market trades above the 78.6% Fib level).
Then, stop loss could be placed at the lowest level of the first candle or the 0.0% Fibonacci level (which is the lowest level of the previous price range). Finally, a take-profit order is placed at the highest level of the previous trend or at one of the following Fib levels.
The Three White Soldiers Pattern – Pros and Cons
These are the most common pros and cons of trading the three white soldiers pattern:
Pros
- Easy to identify
- Accurate chart pattern, mainly when used in combination with trend reversal indicators and Fibonacci levels
- Works on short term and long term trades
Cons
- May produce false signals – frequently appears in middle price range consolidation mode
- Stop-loss distance is very tight, is not using Fibonacci levels
Key Takeaways
Here are the key takeaways you need to consider when using the three white soldiers pattern.
- The three white soldiers is a bullish reversal pattern that is composed of three bullish green candles at the bottom of a downtrend
- Traders use the formation to identify the slowing momentum of an ongoing downtrend and find buying opportunities for the chosen asset
- When identifying the three white soldier pattern, a trader will enter a position once the third candle has completed
- Ideally, traders who identify the white soldier candle pattern should confirm the reversal with other technical indicators – RSI, Stochastic, MACD, and Fibonacci support and resistance retracement levels
- Stop loss is located at the lowest level (or below) of the first candle. Take profit is located at the highest price level of the previous trend
Risk Disclosure: The information provided in this article is not intended to give financial advice, recommend investments, guarantee profits, or shield you from losses. Our content is only for informational purposes and to help you understand the risks and complexity of these markets by providing objective analysis. Before trading, carefully consider your experience, financial goals, and risk tolerance. Trading involves significant potential for financial loss and isn't suitable for everyone.