


Are you familiar with technical chart patterns? If not, read on to learn more about one of the most commonly found in the financial markets charts — the rounding top pattern.
This article will teach you how to identify, interpret, and trade the rounding top.
What is the Rounding Top Candlestick Pattern?
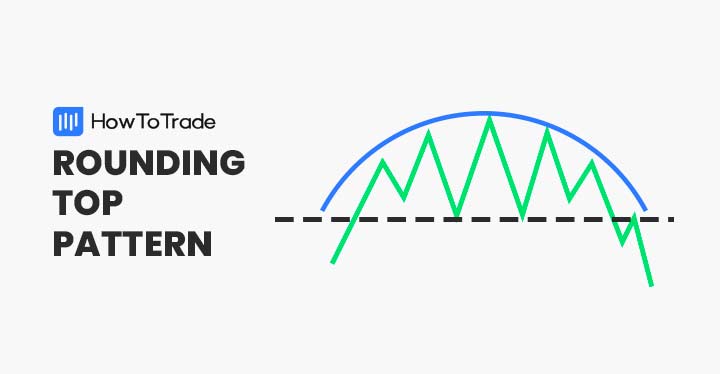
The rounding top chart pattern is a tool used in technical analysis. It is classified as a reversal indicator.
The rounding top forms amid a bullish trend and suggests forthcoming bearish price action. It is the opposite of a continuation pattern as it predicts a trend reversing, not extending. The opposite of the rounding top is the rounding bottom pattern, where you can expect a bullish reversal.
Financial market traders view the rounding top as a signal to short a currency pair or exit a long open position.
How to Identify and Use the Rounding Top?
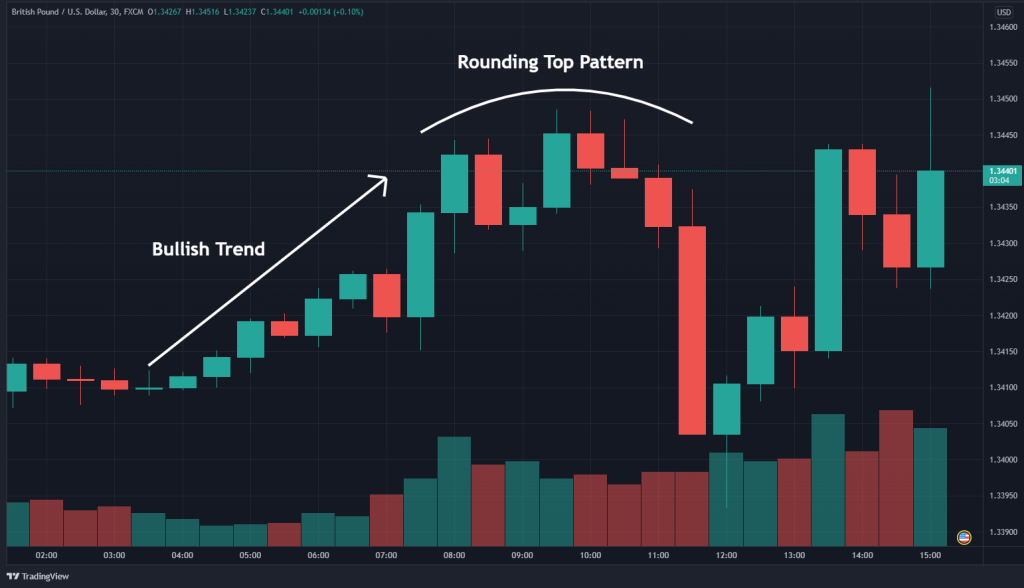
The rounding top is a reversal pattern that occurs during an uptrend. As you can see in the GBP/USD chart below, it has the shape of an inverted parabola.
Follow the steps below to distinguish the rounding top:
- Identify an uptrend in price action
- Observe an extended period of stalled price action
- Draw a curved line approximating the upper extremes
- Consider selling the FX pair in anticipation of a reversal
Step 1: Find a Bullish Trend
The first step in using the rounded top pattern is recognizing a bullish trend on your price chart. A bullish trend is a series of higher highs and lower lows. It may result from a single or series of upward price breaks.
Step 2: Construct the rounding top
The rounding top has a distinct visual appearance. Essentially, it is a series of periodic highs that decrease in magnitude. As a result, the rounding top looks like a curve with a downward slope. During formation, the rounding top tends to display declining trading volumes.
Graphing the rounding top pattern is straightforward. After an uptrend, identify a period of “flat” or exhaustive price action. Then, draw a trend line that approximates the periodic highs. A curved, umbrella-like line should be the final product.
Step 3: Draw the Neckline
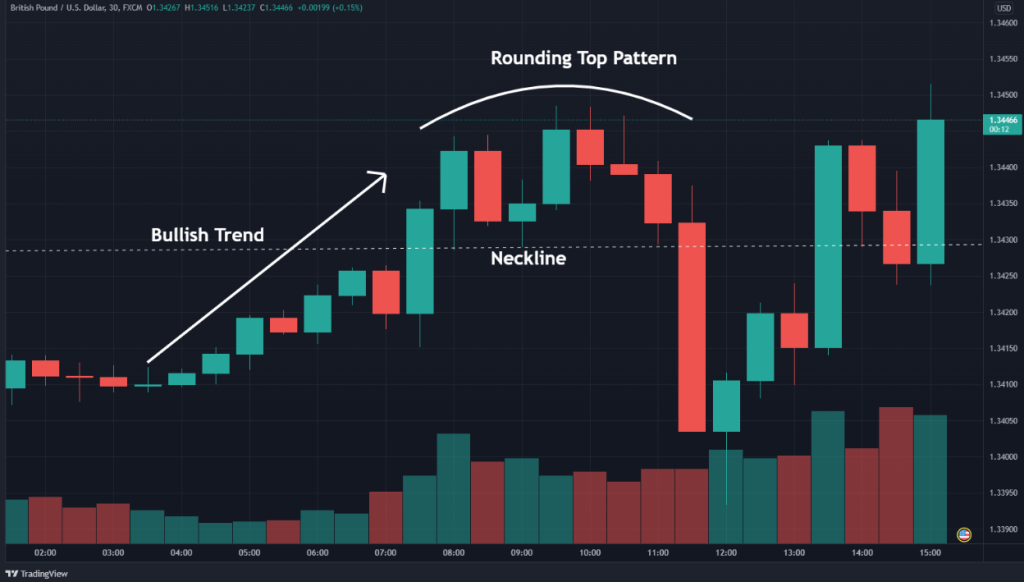
The neckline is a standard price point that defines the lower extreme of the rounding top pattern. It is considered to be a support level. The GBP/USD chart below illustrates the location of the neckline.
How to Trade the Rounding Top?
Trading the rounding top chart pattern is an intuitive, straightforward process. Like all bearish reversal patterns, it signals a possible selling opportunity. This is the opposite of a bullish continuation pattern like the bull pennant pattern.
To trade the rounding top, all you need to do is identify the market entry, place a stop loss, and profit target.
1. Market Entry
Entering the market with the rounding top is relatively simple. All you need to do is sell beneath the bottom of the actual pattern. This may be done as follows:
- Identify the pattern
- Draw the neckline (support)
- Enter a sell order beneath the neckline
2. Stop Loss
The stop loss location for the rounding top chart pattern is above the final periodic high in the pattern. This limits risk and helps maintain an agile trading strategy.
3. Profit Target
Typically, the profit target for a rounding top trade is determined by the height of the actual pattern. The pattern’s height is the distance from the neckline to the upper extremity. Generally, the greater the height, the greater the desired profit target.
Trading Example
The GBP/USD example below illustrates how the rounding top price pattern is traded. Like any other classical technical analysis pattern, exercising prudent risk management is advised.

The GBP/USD trade above was executed as follows:
- A sell order was placed beneath the neckline at 1.3428.
- A stop-loss order was placed above the most recent high, 1.3448.
- The profit target was placed at 1.3408, the same distance from entry as the stop loss of 1.3408 (1:1 risk vs. reward).
The Rounding Top Chart Pattern – Pros and Cons
Like other chart patterns, the rounding top has a distinct set of pros and cons.
Pros
- Easy to identify
- Occurs frequently in all markets on all time frames
- Often precedes considerable bearish trends
Cons
- Can produce false signals in consolidating markets
- Large heights can make the rounding top expensive to trade
- Trades can take a while to execute on longer time frame charts
Everything About the Rounding Top Pattern in One Video
Watch this video to learn how to identify and trade the rounding top pattern with a real-time example.
Key Takeaways
Here are the key takeaways you need to consider when using the rounding top pattern.
- The rounding top pattern is a bearish reversal pattern. It occurs during a pronounced uptrend in price.
- The formation consists of periodic highs and may include double and triple top patterns. Visually, the rounding top is similar to an inverted parabola.
- To trade the rounding top, a sell entry is placed below the neckline. The stop loss is located above the most recent periodic high. Profit targets are set beneath the pattern relative to the pattern’s height.
- The rounding top isn’t 100% accurate. It is best traded with sound risk management principles.
Risk Disclosure: The information provided in this article is not intended to give financial advice, recommend investments, guarantee profits, or shield you from losses. Our content is only for informational purposes and to help you understand the risks and complexity of these markets by providing objective analysis. Before trading, carefully consider your experience, financial goals, and risk tolerance. Trading involves significant potential for financial loss and isn't suitable for everyone.


