What is Support and Resistance in Forex?
It’s time to dive deeper into understanding and drawing support and resistance lines on your forex charts and use other technical analysis indicators.
Many proficient traders view support and resistance lines as fundamental to their trading skills and consider it an effective technical analysis technique. The forex market is such that many traders are concentrated on a small number of currency pairs, making a case for increased market pressure around these support and resistance levels we will soon be unraveling. So, let us get right to it.
What Are Support and Resistance Lines in Forex Trading?
Support and resistance levels are regions in the market where price action is very likely to make a rebound in the opposite direction. More specifically, a support level is that region where a falling price action reaches before making an upward turn. The region must be characterized by repeated behavior of such price patterns in the past as many times as possible before it is marked as a support level.
The support region gives an insight into the market dynamics by suggesting areas where buyers’ pressure often overwhelms sellers’ pressure to move price action upwards. You’ll notice that the price rises from it as soon as it reaches it. Traders, therefore, look for opportunities to place a buy trade in this region to join in the buyers’ traction.
On the other hand, resistance refers to a region on the forex charts where a rising price action meets stiff opposition toward a downward direction. Usually, price action also exhibited the same pattern in this region several times to make the region a proper resistance level. A resistance level indicates an area where sellers’ pressure repeatedly overwhelms buyers’ pressure to drive price action downwards. As a result, you’ll often see that the price bounces off the level. So, traders look for opportunities around this region to enter a sell trade.
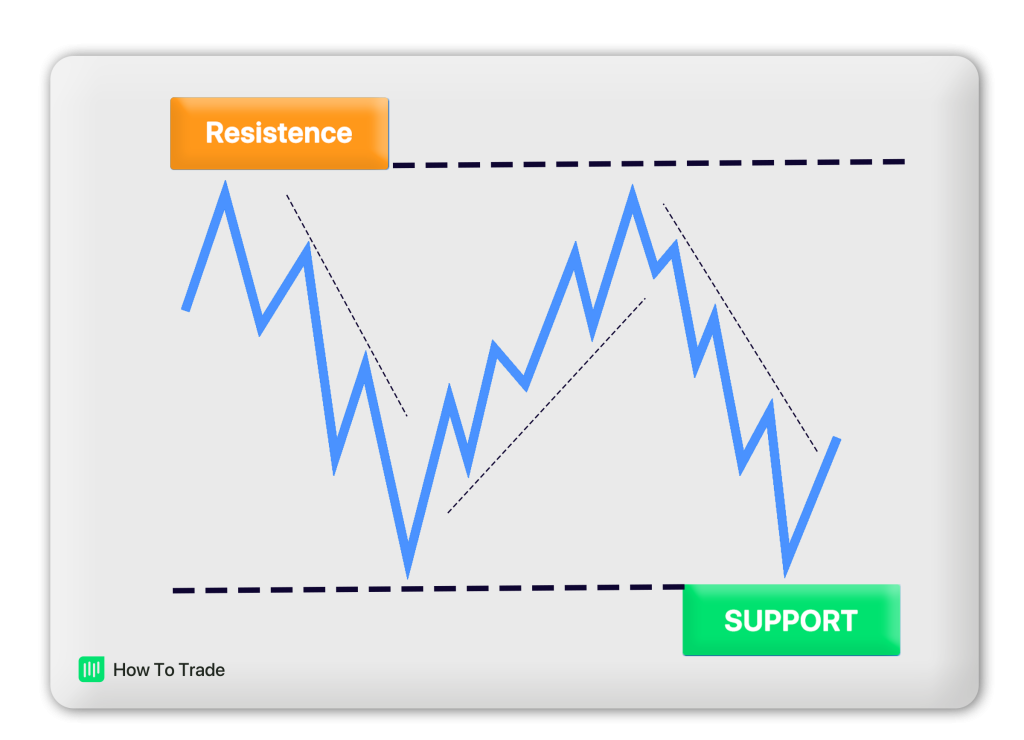
From the image above, we draw the support line where falling prices stop and move in the opposite direction as a first condition and ensure that there is at least another point in the same region in the past where price action exhibited the same pattern. We consider that region the “floor” supporting or holding up prices.
Conversely, we draw our resistance where a rising price action “peaks” before moving downwards after ensuring that price action did the same in that region in the past. The resistance level serves as a “ceiling” that keeps prices from rising. Therefore, while support levels tell us where there will be a surplus of buyers so that we can buy, resistance levels indicate where there will be a surplus of sellers so that we can short (sell).
What Do Support and Resistance Tell You?
Support levels denote that the price of a currency pair will not likely fall below that price level. In contrast, resistance levels indicate that the currency pair’s price will likely not exceed the resistance level. Bear in mind that support and resistance levels are not regions of certainties. Instead, they act more like regions of high probability that price action will behave like it did in the past.
Traders use support and resistance zones as litmus tests for buying and selling an asset when price action reaches them. In other cases, they serve as regions for a change of strategy if the price drops below the support level or the price breaks above the resistance level.
Generally, using the support and resistance indicator tool, Forex traders can more accurately predict whether a current trend will keep going in an established direction or make a reversal. This enables them to adjust or adapt their trading strategy to the prevailing market dynamics.
How to Draw Support and Resistance Levels
Now that you have a clearer understanding of support and resistance levels, you may have noticed our use of the words “areas” and “regions” to describe these levels. It is arbitrary because that is what they are: regions and areas rather than exact price lines. Also, round numbers (numbers that have two or more zeros at their ends) tend to make support and resistance levels. This is possible because market participants are more likely to place buy orders at 1.2000 instead of 1.19832.
When you understand these key concepts, plotting these levels on your price charts and using them to your advantage becomes much more accessible.
For support levels, look for regions of two or more price “floors” lying on the same horizontal line and draw a line to connect them. The same applies to resistance levels with two or more price “ceilings.” The more price action reaches and turns away from a support or resistance level, the stronger that level becomes as a future support or resistance.
Throughout your forex trading journey, you will often encounter support or resistance level, but soon after, you’ll find out that the market was just testing it. If you’re using candlestick charts, these “price tests” of support and resistance areas generally represent the candlestick shadows that pop out of the support or resistance area.
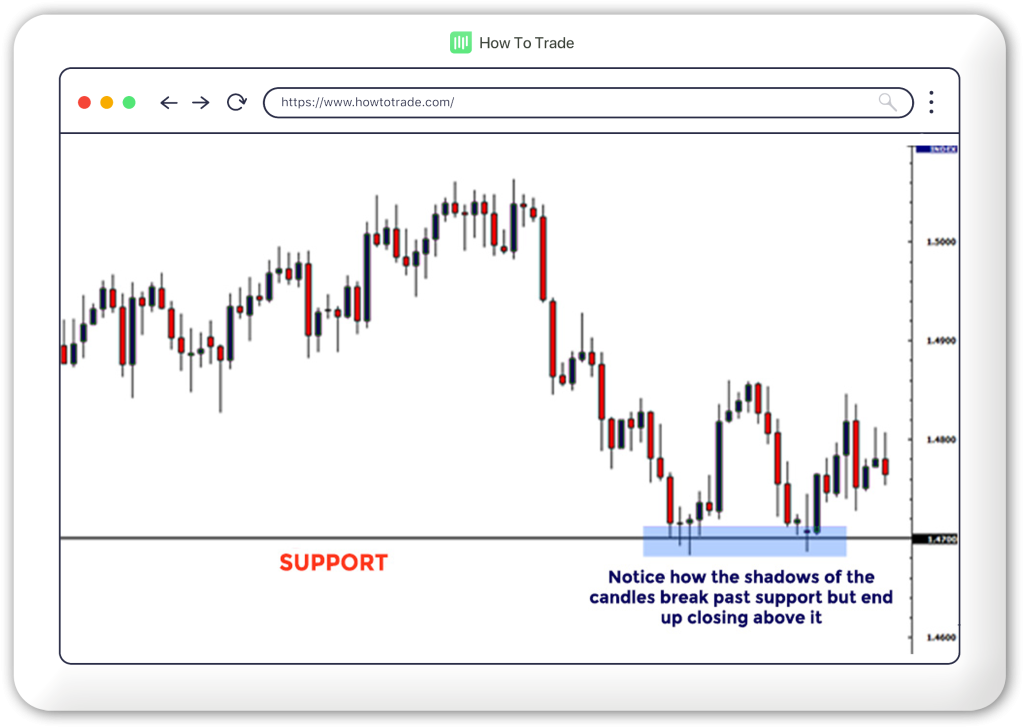
From the picture above, it is clear that price action briefly broke below the support level before retracing back up. This condition is a false breakout. Therefore, it is crucial to wait for a candlestick that appears to be breaking a support or resistance level to close before making a trade decision.
Another technique to minimize false breaks’ effects is plotting your support and resistance lines on a line chart instead of candlesticks. This is because line charts draw out only the closing prices while candlesticks add the high and low prices, which makes the charts too detailed for support and resistance lines.
Nonetheless, if you insist on trading forex with candlestick charts, you should still use the rule of waiting until the candle is fully completed. Some traders meticulously wait for the second or third candle after the price tests the support or resistance before making a trading decision.
Trendlines as Support and Resistance
So far, we have discussed the concept of support and resistance as horizontal levels that form barriers to price actions. However, in the forex market, price action always trends upwards or downwards on a holistic frame. This situation implies that the price barriers are likely to change positions occasionally, creating room for diagonal support and resistance lines.
When price action moves upwards, it does so in a pattern that creates a support line that rises along with it. This means that price action makes higher lows consistent with a particular level in an upward slope. Therefore, as the price retraces downward in an overall upward trend, it will likely not break below the diagonal support formed with it.
The same applies in an overall bearish market where a trendline forms a resistance as price action makes lower highs. Expect the price to repeatedly test a region above the highs as it moves downward. However, even in an uptrend or downtrend, price action can flow through a channel of diagonal support and resistance simultaneously, with price action bouncing up and down the support and resistance as it trends upwards and downwards.
From the image above, as price action moves up and retraces in an overall upward trend, it does that within the confines of an upper resistance trend line and a lower support trend line. This usually happens for a while before price action breaks either the support or resistance.
Our support and resistance levels are psychological regions where price action repeatedly tests before making a U-turn. These psychological levels can be horizontal or form an uptrend and downtrend themselves.
Technical Indicators as Support and Resistance
In addition, some other indicators can serve as support and resistance tools. Forex traders often use moving averages and Fibonacci retracement to map support and resistant lines. While moving averages create a support or resistance line as it flows with price action, Fibonacci retracement helps to mark out arbitrary levels of horizontal support and resistance based on the tool’s settings. Price action repeatedly tests the lines of these tools to confirm a psychological level around it. When the price breaks out of any of the lines, traders spring into action by selling if the price moves below the support line or buying when it moves above the resistance.
How Do You Trade Support and Resistance Levels?
There are two primary ways to trade support and resistance levels. They are Range trading and breakout trading strategies.
In range trading, you identify a range between support and resistance levels to buy the asset at the support level and sell it at the resistance level. Using this support and resistance trading strategy, you essentially believe that the market is in equilibrium, and the price action is expected to stay in this range for a while.
The second method is the breakout trading strategy. As the name indicates, it happens when the price breaks above or below the support and resistance zones (usually with high trading volume and at times of market news). Therefore, a breakout forex trader will typically enter a position when the price moves beyond the support or resistance levels.
A break out from the support and resistance levels is more likely when price action builds momentum towards the levels gradually. In this case, the market may not be apprehensive about a reversal as it does not take note of the price momentum. However, when the price moves very quickly towards a support and resistance level, the increased momentum may cause the market to set a stiff barrier against it in apprehension of the forecast support or resistance level.
Remember to use any of these support and resistance strategies as the market condition requires. If, for example, you focus on a currency pair that is rebounding in a range, you can leverage the range trading strategy. However, you can quickly switch to the breakout strategy when price action breaks below the support or above the resistance levels.
Key Takeaways
- Using support and resistance levels is one of the most common and practical technical analysis tools to trade financial assets when mastered.
- The support level acts as a floor for price action, while the resistance level acts like the ceiling.
- Support and resistance levels are more of a region on the price chart rather than specific price points.
- Trendlines can sometimes serve as support and resistance lines for price action
- Other tools for support and resistance lines are the moving averages and Fibonacci retracement.
- Trade the support and resistance levels using the ranging or breakout strategies.


Up To $5,000 Credit!
- Trade 1,000’s of global markets.
- 0% deposit and withdrawal fees.
- Rapid funding turn-around times.
- Trade on MetaTrader 4 and 5.