The inverse head and shoulders is a candlestick formation that occurs at the end of a downward trend and indicates that the previous trend is about to reverse.
Often associated with bullish price reversals, this unique pattern is one of the most accurate and effective chart patterns in technical analysis.
But how do you identify and use it? And how can you maximize your profitability when using the inverse head and shoulders chart pattern? All the answers are in this article.
- What is the inverse head and shoulders candlestick pattern?
- How do you identify and use the inverse head and shoulders candlestick pattern?
- How do you trade the inverse head and shoulders candlestick pattern?
- What’s the target price when the price breaks below the neckline?
- What are the inverse head and shoulders candlestick pattern pros and cons?
- Inverse Head and Shoulders Pattern (VIDEO)
- How accurate is the inverse head and shoulders pattern?
- Key takeaways
What is the Inverse Head and Shoulders Candlestick Pattern?
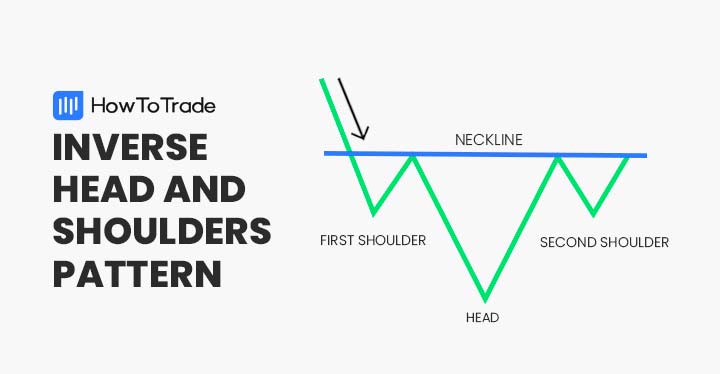
The inverse head and shoulders pattern is a bullish candlestick formation that occurs at the end of a downward trend and potentially signals the end of a trend and the beginning of a new upward trend.
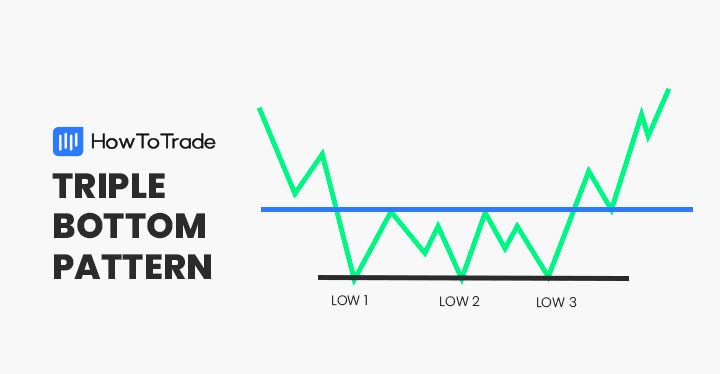
It is the opposite version of the head and shoulders pattern (which is a bearish reversal pattern) and has a similar structure and logic as the double bottom pattern and the triple bottom pattern.
In terms of its structure, the inverse head and shoulders pattern has three bottoms with the middle bottom being lower than the first and third bottoms (the two shoulders). As a result, it has a formation of inverse head and shoulders.
How do You Identify and Use the Inverse Head and Shoulders Candlestick Pattern?
To identify the inverse head and shoulders pattern on a trading chart, you need to find three bottoms with the following components – left shoulder, head, and right shoulder. Furthermore, the pattern appears at the end of a downward trend and should have a clear neckline used as a resistance level.
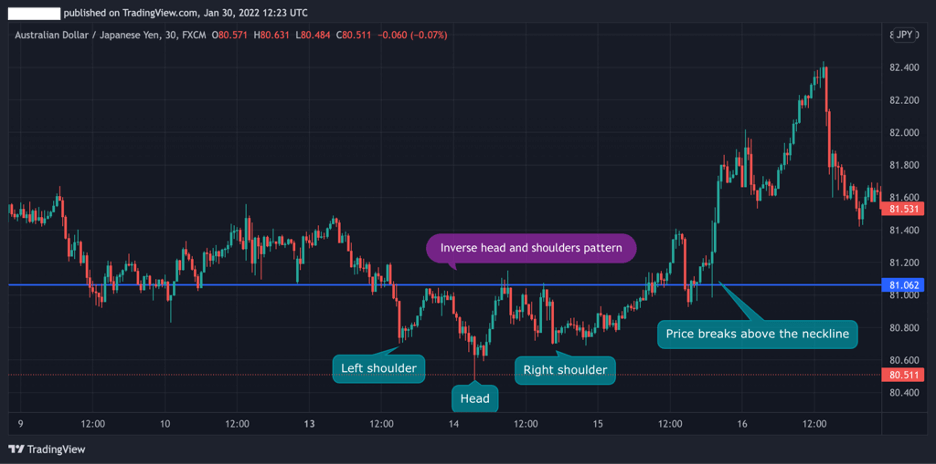
In the AUD/JPY chart below, you can see how the inverse head and shoulders pattern was formed after a bearish trend and include the left and right shoulders and the head bottom level. As soon as the price breaks above the neckline level, a new bullish trend starts.
With the above in mind, the next steps can help you in identifying and using the inverse head and shoulders pattern:
- Identify three bottom levels after a downward trend that include left shoulder, head, and right shoulder
- Find the neckline resistance line
- Wait for the breakout to occur and place a buying order once a candle closes above the neckline
- Set a stop-loss order below the neckline (preferably at the lowest level of the right shoulder) and use a risk-reward ratio
How do You Trade the Inverse Head and Shoulders Candlestick Pattern?
Since the inverse head and shoulders is a bullish trend reversal pattern, you’ll obviously need to find the ideal entry-level for a long position. But much like any other technical chart pattern, there are several ways and techniques to trade the inverse head and shoulders pattern.
Below, we mention two trading strategies to use this unique pattern:
1. Trading the Breakout
The most common way to trade the inverse head and shoulders pattern is to immediately enter a position when the price breaks above the resistance neckline.
In this case, once you’ve identified the right shoulder and have a clear neckline level, you are ready to enter a position when the breakout occurs.
Let’s see an example of the inverse head and shoulders breakout.
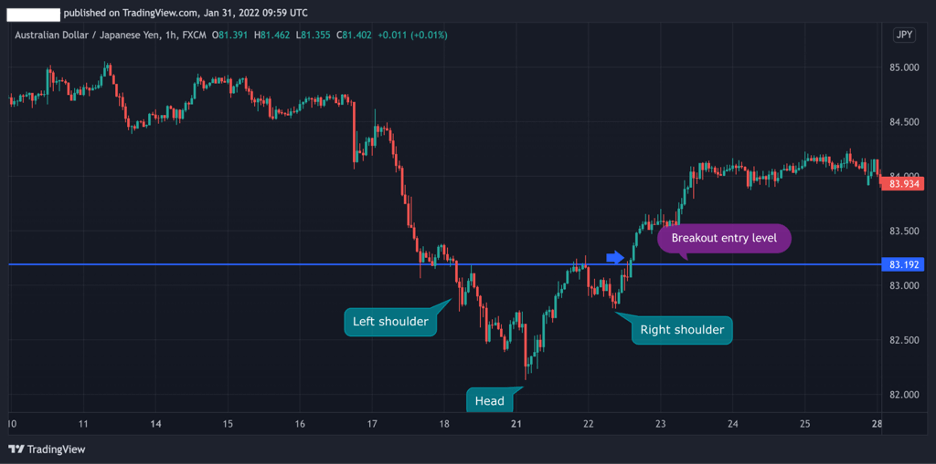
As you can see in the AUD/JPY 1H chart above, when the breakout occurs, there’s no retest around the neckline and the price rises. The risk in using this technique is that in many cases a price pullback might occur (or a false breakout) and your stop loss will be triggered.
To protect yourself from this situation – when you enter a position at the breakout, it is advisable to place the stop loss market order at the lowest level of the right shoulder bottom.
2. Confirm the Inverse Head and Shoulders Pattern with Fibonacci Levels
Even though many traders like to work on a clean price chart without any drawings and technical analysis tools, which is a strategy known as the naked trading strategy, in my view it is vital to confirm a charting pattern with other technical indicators. One such tool is Fibonacci support and resistance levels.
Taking the same example from above, we have added Fibonacci retracements from the highest level of the previous trend to the lowest level of the head section.
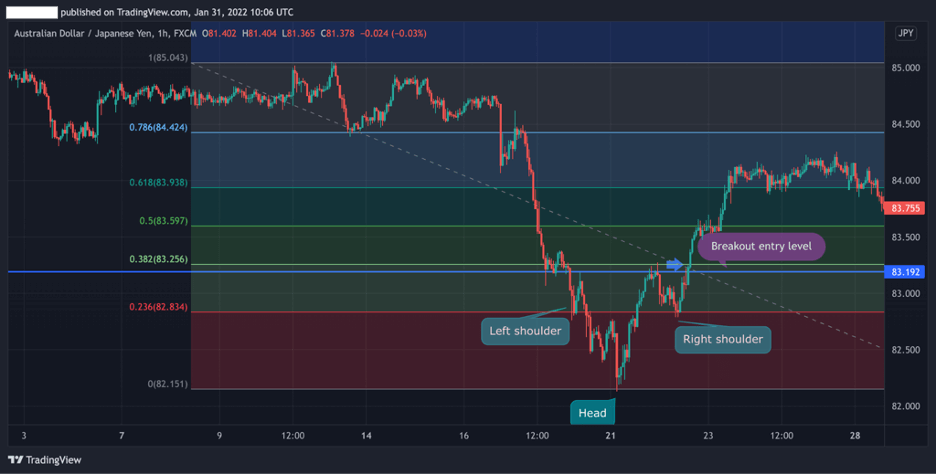
As seen in the AUD/JPY chart, the 38.2 % Fibonacci level is slightly above the pattern’s neckline and serves as another confirmation of a trend reversal.
In that scenario, a trader will enter a long position once the price rises above the 38.2% level and place a stop-loss order at the 23.6% level, which is the lowest level of the second shoulder.
What’s the Target Price When the Price Breaks Below the Neckline?
In trading, exiting a position can be quite challenging for traders and finding the right profit targets levels requires experience and trading skills. For that matter, when you identify the inverse head and shoulders pattern and you are looking for a target price to exit the position, the best solution is to draw Fibonacci retracement levels and set your take profit target at one of the next Fibonacci levels.
Another way is to measure the distance from the tip of the head of the pattern to the neckline. The same distance from your neckline to the tip will be your take profit level.
The Inverse Head and Shoulders Pattern – Pros and Cons
These are the most common pros and cons of trading the head and shoulders chart pattern:
Pros
- An accurate and reliable charting pattern
- Stop loss and take profit levels are well defined
- Works well with Fibonacci levels
Cons
- Could be complicated for beginner traders to identify the pattern
Everything About the Inverse Head and Shoulders Pattern in One Video
Watch this video to learn more about the inverse head and shoulders chart pattern.
How Accurate is the Inverse Head and Shoulders Pattern?
In essence, the inverse head and shoulders pattern is a bottoming chart pattern – meaning, sellers fail in pushing prices lower below a certain support level. As a result, in the vast majority of cases, the asset’s price is expected to rise after the inverse head and shoulders pattern has occurred and the pattern is, indeed, among the most accurate patterns in technical analysis.
Key Takeaways
In conclusion, here are the key takeaways:
- An inverse head and shoulder is a bullish reversal pattern that appears after a downward movement and may signal a possible trend reversal
- To identify the inverse head and shoulders candle pattern, you need to find three bottoms after a bearish trend with the following components – left shoulder, head, and right shoulder
- A trade should be made when the price breaks above the neckline with a stop loss at the lowest level of the right shoulder
- As a trading strategy, the inverse head and shoulders pattern works best in combination with Fibonacci levels
Risk Disclosure: The information provided in this article is not intended to give financial advice, recommend investments, guarantee profits, or shield you from losses. Our content is only for informational purposes and to help you understand the risks and complexity of these markets by providing objective analysis. Before trading, carefully consider your experience, financial goals, and risk tolerance. Trading involves significant potential for financial loss and isn't suitable for everyone.