


A descending triangle is a bearish continuation chart pattern that occurs during a downward trend and signals the trend is expected to continue.
But what does the pattern look like? How to identify it and how to trade currency pairs using this chart pattern? All the answers are in this article.
- What is the Descending Triangle?
- How do you identify and use the Descending Triangle Candlestick Pattern?
- How do you trade the Descending Triangle Candlestick Pattern?
- What’s the difference between the descending triangle chart pattern and the falling wedge pattern?
- What are the descending triangle candlestick pattern pros and cons?
- Descending Triangle Pattern (VIDEO)
- Key takeaways
What is the Descending Triangle Candlestick Pattern?
A descending triangle is a bearish chart formation. The pattern forms during a downtrend and indicates that the existing trend is likely to continue.
Much like its opposite version, the ascending triangle pattern (which is a bullish continuation pattern), the descending triangle pattern works as a continuation bearish pattern and helps traders find entry and exit points during a downward trend.
The pattern has the following characteristics – a horizontal lower trend line that acts as a support level and a descending trend line with lower highs that acts as an upper trend line resistance. And much like nearly all candlestick patterns, traders usually enter a position when the price breaks below the support line, which signals that the trend may continue.
Basically, it comprises a bearish move, a brief consolidation, and a continuation to the bearish.
How do You Identify and Use the Descending Triangle Candlestick Pattern?
Generally, it’s fairly easy to recognize. First, the descending triangle appears at the end of a bearish rally when the price consolidates before making another move.
Secondly, you need to find a trend line with lower highs and a lower trend line support level – those creating a shape of a triangle. To do so, many traders use the descending channel pattern to get a better indication of the market’s trend. Finally, once you have identified the pattern, you’ll be waiting for the breakout to occur, which signals the trend is strengthening.
As you can see in the GBP/JPY 5-minute chart below, the market is in a downward trend. However, at some point during the trend, prices have consolidated, creating descending highs and a lower support trend line.
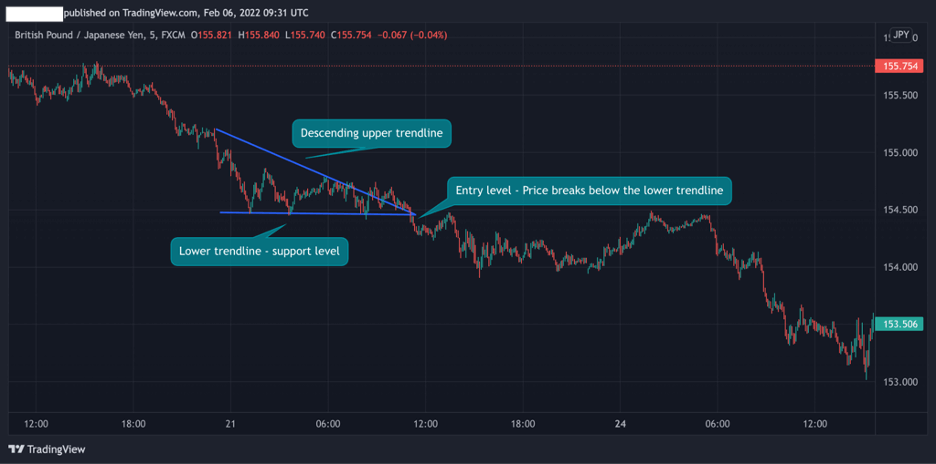
Then, when the breakout occurs, the pattern is confirmed and the bearish trend continues. A trader will, therefore, enter a position after the breakout with a stop loss at the highest level of the last price swing inside the triangle.
To sum up, here are the steps you need to take in order to identify and trade the descending triangle candlestick pattern.
- Identify price consolidation during a bearish trend
- Draw the lower horizontal line with at least two failed attempts to break the support level
- Recognize a descending trendline with at least two lower highs, a sign that the bullish volume declines with time.
- Wait for the breakout to occur and place a selling order when the first candle following the breakout closes below the lower line (in order to confirm the breakout).
- Set a stop-loss order above the lower horizontal support line
How do You Trade the Descending Triangle Candlestick Pattern?
Simply put, trading the descending triangle pattern means you are looking to join a trend. As a continuation chart pattern, it helps you find a price signal where you can enter a position and make profits.
Still, to help you understand how to trade this unique chart pattern, below we are going to show how to use the breakout trading strategy and the descending triangle measuring technique.
1. The Descending Triangle Breakout Trading Strategy
When trading the market using chart patterns, it’s all about trading the breakout. Whether the formation is a trend reversal pattern or continuation pattern, in the vast majority of cases, you’ll be looking to enter a trade after the breakout occurs and the price gets outside of a defined price range.
Not surprisingly, this is also the case with the descending triangle breakout strategy. In the chart below, you can see how the breakout helps you find a good entry-level by using the descending triangle pattern:
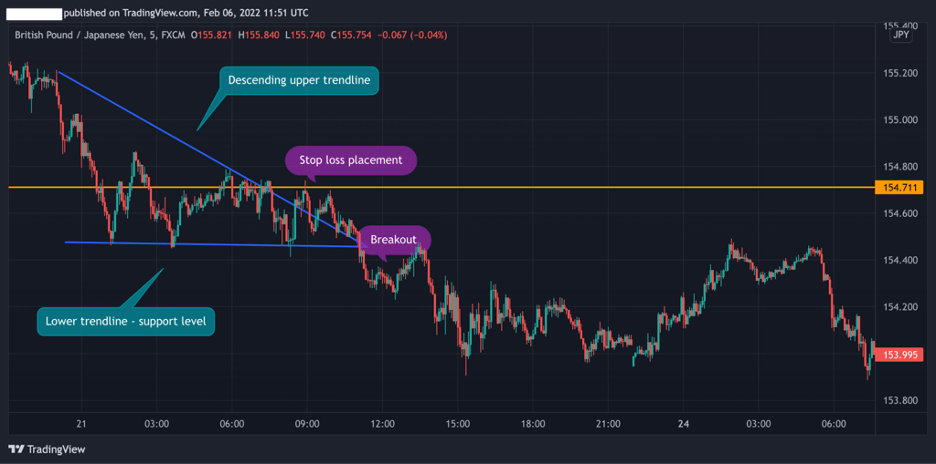
One important aspect to keep in mind when trading the breakout is where you should place your stop-loss order. After all, there are lots of false breakouts and the markets typically have an unpredictable nature.
To avoid this, it’s best to place a stop-loss order (or exit a position without setting a stop-loss order) at the highest level of the last price swing before the breakout occurred (the orange line).
2. The Measuring Technique for Taking Profit Target
In technical analysis, the measuring technique helps traders estimate the next price movement based on previous trading activity. In other words, if you know how to correctly use this technique, you’ll be able to predict the length of the next trend.
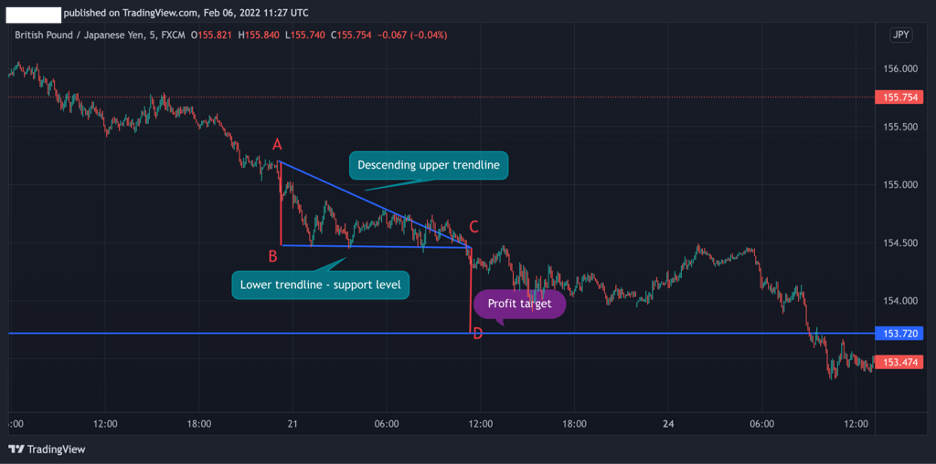
The great thing about the descending triangle pattern is that you can use the measuring technique and know exactly where to place your take profit order. In the above chart, you can see how the “AB” line is equal to the “CD” line. So, if you were using this technique, you could potentially predict your exact target price level.
What’s the Difference Between the Descending Triangle Chart Pattern and the Falling Wedge Pattern?
Even though the regular descending triangle pattern and the falling wedge pattern have similar formations, they are different in meaning and outcome. While the falling wedge is a trend reversal pattern with lower lows and lower highs trendlines, the descending triangle pattern is a continuation pattern that has lower highs and equal lows that create a horizontal support level. It is similar to the symmetrical triangle pattern in its purpose.
What are the Descending Triangle Candlestick Pattern Pros and Cons?
Here are the most common pros and cons of trading the descending triangle candlestick pattern:
Pros
- Easy to identify and use
- Offers a clear breakout level
- By using the measuring technique, traders can easily define take profit targets
- One of the most reliable and accurate continuation patterns in technical analysis
Cons
- The pattern rarely appears in perfect formation
- Not an effective pattern for swing and long term investors
Everything About the Descending Triangle Pattern in One Video
In this video, our trading analysts explain how to identify and trade the descending triangle pattern.
Key Takeaways
In conclusion, here are the key takeaways:
- The descending triangles is a bearish chart pattern that appears during a downward trend
- Traders use this pattern to find entry and exit levels during an ongoing downtrend
- The key characteristics of the descending chart pattern include is a lower horizontal line with at least two lows, a descending upper trend line with at least two lower highs, and a price intersection (the C level in the chart) where traders enter a selling position when a breakout occurs
- When using the descending triangle pattern, traders enter a selling position when the breakout occurs. The measuring technique helps traders find a take profit target
Remember that no single trading tool should be used in isolation. Always confirm your signals on one tool with the signals from other technical indicators or tools. The more tools you have predicting your move, the merrier.
Related Chart Patterns to the Descending Triangle Pattern
Here are some chart patterns that are closely related to the descending in terms of structure and meaning.
Risk Disclosure: The information provided in this article is not intended to give financial advice, recommend investments, guarantee profits, or shield you from losses. Our content is only for informational purposes and to help you understand the risks and complexity of these markets by providing objective analysis. Before trading, carefully consider your experience, financial goals, and risk tolerance. Trading involves significant potential for financial loss and isn't suitable for everyone.


