


Developed in 1930 by Richard Wyckoff, the Wyckoff candle pattern is one of the most valuable technical analysis methods to predict future price movements and find market trends.
This article will explain how this method works and how to identify and use the Wyckoff chart pattern.
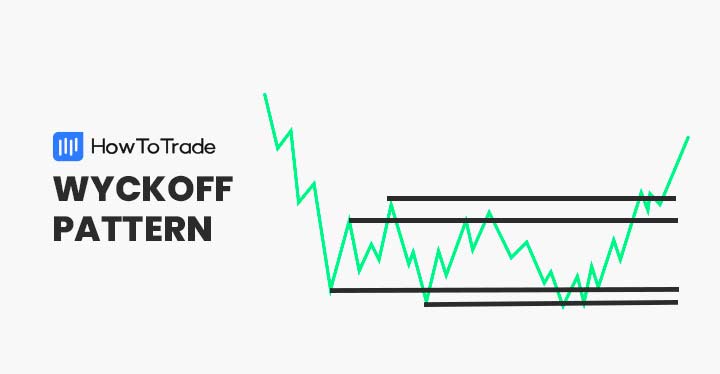
What is the Wyckoff Pattern?
The Wyckoff accumulation method was developed in the 1930s by Richard Wyckoff, an American investor and developer of several technical analysis techniques.
Although Wyckoff used bar charts and the method was primarily tested on the stock market index, it can also be applied to any other financial market and can be used on Japanese candlestick charts as well.
According to this method, the Wyckoff Accumulation occurs when the price of a particular asset falls or rises following a trend and then enters a period of price consolidation. In this range, prominent players can presumably manipulate the price to buy the asset at a lower price (or higher if the pattern is bearish).
If you’ve ever seen the movie Rogue Trader, there’s a perfect example of how traders manipulate the markets to buy financial instruments at a lower price. This is what Wyckoff has succeeded in identifying on trading charts – understanding where the smart money is going.
What’s more, according to Wyckoff’s market cycle theory, there are four steps in the price cycle of any financial instrument – Accumulation, markup, distribution, and mark down.
So in that sense, retail traders who plan to use the Wyckoff method will be looking for the accumulation phase where they expect large players and institutional traders to place large order blocks and enter the market and push prices higher (or lower).
How to Identify and Use the Wyckoff Pattern?
To identify the Wyckoff pattern, you first need to be familiar with the market structure and phases of the Wyckoff method (Accumulation and reaccumulation, markup, distribution, and markdown). After all, that was Richard Wyckoff’s goal —to portray the phases in the stock and financial markets on trading charts with a set of rules and guidelines.
However, the trick with the Wyckoff chart pattern is that you need to identify only half of it. For example, when a bullish Wyckoff chart pattern appears, you’ll have to identify the last markdown phase, when the price decreases from the previous market trend and the accumulation phase.
Then, you can finally conclude that the Wyckoff pattern forms whenever there is a high volume in that specific price range after a bullish or a bearish rally.
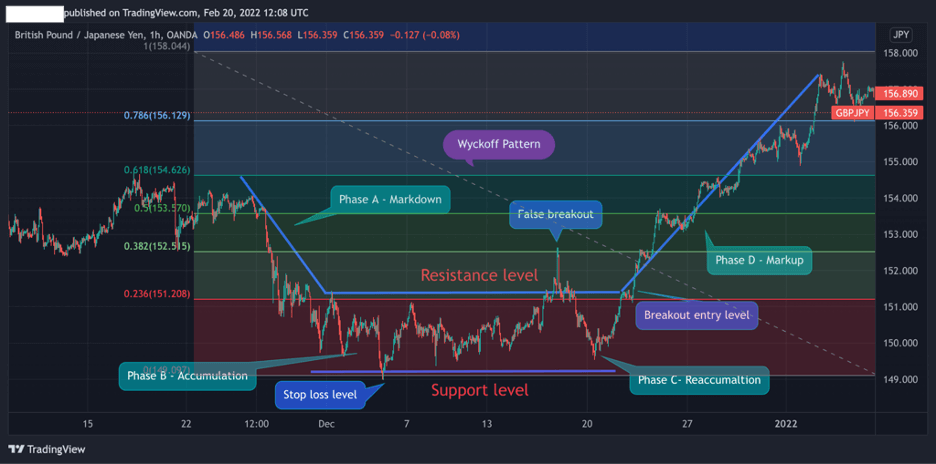
Ok, maybe it’s a bit confusing. Let’s look closer at how the Wyckoff candle pattern looks on a GBP/JPY 1-Hour price chart.

The chart above shows the four stages – markdown, accumulation, reaccumulation, and markup. Further, based on the Wyckoff theory, another step is expected to happen at the top of the markup phase – the Wyckoff distribution phase.
At this phase, the buying pressure ends, and smart traders basically close their positions.
Therefore, once you can identify the markdown and the accumulation phases, you can enter a position to join large players such as institutional investors and other forex market participants.
To sum up, to identify and trade the Wyckoff pattern, here’s what you need to remember:
- Identify a trading range (the accumulation phase) with high trading volume following a bullish or bearish trend (the markdown or markup phase)
- Draw support and resistance lines to get a clear visualization of the trading range
- Enter a long or short selling position (if the pattern is bearish) at the breakout level
- Set a stop-loss order at the bottom (or top) of the accumulation range area
- Wait for the distribution level, which should be around the high levels of the previous trend, and close the position
Everything About the Wyckoff Chart Pattern in One Video
You can check our detailed video on how to identify and trade the Wyckoff candle pattern.
How to Trade the Wyckoff Pattern?
Obviously, the Wyckoff trading method is a very wide concept and has no end. Not only is it a candlestick chart pattern, but it is also a trading technique that can be used in combination with all other trading strategies. In a nutshell, it’s a trading theory.
Still, there are trading methods that can help you maximize the chances of success when using the Wyckoff pattern:
1. Trading Range Breakouts and Fibonacci Retracement Levels
The first method, which is also one of my favorite trading strategies, is to identify the trading range (the Wyckoff accumulation phase) and enter a trade once the price breaks above or below the support or resistance levels.
To do that, you first need to find a price consolidation following a downward trend in a lower timeframe. For example, in the 1H chart below, we can see that the accumulation phase appears following a bearish trend; however, in the daily chart, there’s clear bullish market sentiment.
Then, once you have identified the range, try to find the highs and lows of the consolidation range and draw the Fibonacci retracement level from the highest level of the previous price swing to the lowest level of the trading range.
Now, everything is set up correctly for you to see the Wyckoff pattern, and you are waiting for the breakout to occur.
The chart above shows us the Wyckoff pattern in combination with Fibonacci levels. As you can see, the resistance level and the 23.6% Fibonacci level are almost the same, which confirms the breakout and may also help you find the ideal take-profit target.
2. Wyckoff Pattern Trading Strategy – Using Volume Indicators and MACD
One of the key rules of the Wyckoff method is that the accumulation phase has a high trading volume. In a simple explanation, these are the price levels where large players ‘manipulate’ the markets as they know prices are expected to rise again, and therefore, they accumulate large amounts of the specified asset.
So, obviously, it would be helpful to add a trading volume indicator that will help you confirm the Wyckoff pattern. Furthermore, since the Wyckoff is a trend reversal pattern, a momentum indicator like the MACD could help you to confirm the price trend reversal.
Using the same example above, we added two technical analysis indicators – Average Trading Volume Value (ATVV) and Moving Average Convergence Divergence (MACD).
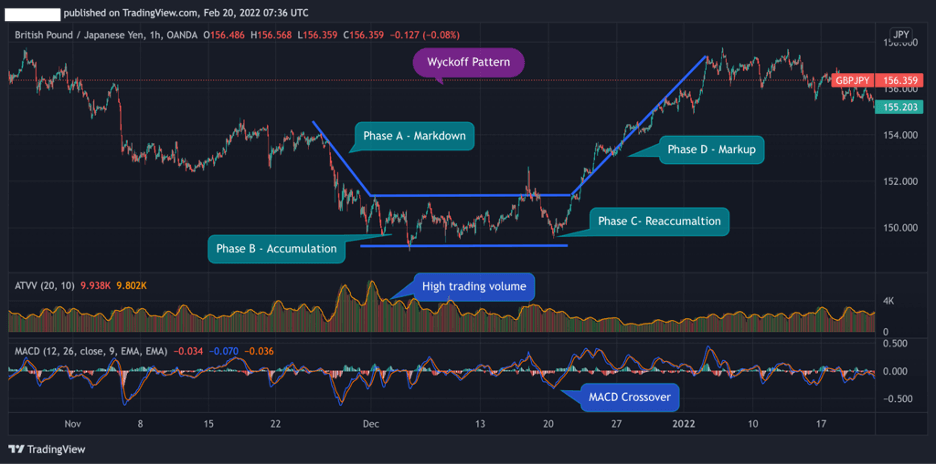
As you can see, the chart above shows us the increasing trading volume activity during the accumulation phase. Moreover, as soon as the market reaches the accumulation phase, the MACD crossover occurs and signals a trend reversal.
The Wyckoff Chart Pattern – Pros and Cons
These are the most common pros and cons of trading the Wyckoff candle pattern.
Pros
- A reliable trading method and charting pattern
- It helps traders get a sense of market sentiment and join large players’ positions
- Works well if used in conjunction with trading volume and momentum indicators
Cons
- Lack of clarity and confusion between the accumulation and distribution phases
- In practice, it’s not easy to use the Wyckoff chart pattern
Key Takeaways
Here are the key takeaways to keep in mind when using the Wyckoff chart pattern:
- The Wyckoff pattern is considered as one of the core principles of technical analysis
- According to the Wyckoff theory, price action moves in a cycle of 4 phases – markdown, accumulation, markup, and distribution
- The key principles of the Wyckoff theory include the law of supply and demand, the law of cause and effect, and the law of effort vs. result
- As part of the theory, Wyckoff also created the notion of the Composite Man. Based on that, individual traders and investors should use the same mindset as the largest market participants and visualize that one entity controls an asset’s price action
- When using this theory, a trader will enter a position at the accumulation phase or when the price breaks above the resistance (or support line). A stop loss should be placed at the bottoms of the accumulation range, and take profit target could be located at the highest (or lowest) levels of the previous trend
Frequently Asked Questions (FAQs)
Here are some of the most frequently asked questions about the bull flag pattern:
Does the Wyckoff method work?
Absolutely, this is a trading theory studied by Richard Wyckoff for many years and has proven to be successful in practice. The theory explains the nature of humans and economic behavior in trading financial assets. Also, the Wyckoff price cycle is one of the most valuable supply and demand patterns of stock prices (which can be applied to any other financial instrument). Note that many traders use a level 2 market data or the order flow analysis method to identify accumulation and distribution phase. These tools can provide a better data technique to recognize price levels where big players enter the market.
What timeframe is best for the Wyckoff method?
In theory, the Wyckoff method is much more effective in long-term time frames. As such, many analysts would recommend using a daily or a weekly timeframe. However, using the Wyckoff pattern in smaller time frames could also help you find the accumulation phase and estimate the probable future trend. These specific time frames include 4-Hour, 2-Hour, and 1-Hour charts.
What is the Wyckoff spring pattern?
The Wyckoff spring is a unique charting pattern that rarely occurs and indicates a sell-off in the market before prices are expected to rise back (and vice versa in the other direction). This phenomenon of intense selling pressure is also known as selling climax (or buying climax in the opposite direction). It refers to a situation when stock prices fall sharply in a short time on heavy trading volume.
Based on the Wyckoff spring pattern, prices will fall below the trading range after the markdown and accumulation phases and then bounce back to close within the range. Then, once the trading range breaks occur, prices will spike up sharply.
Risk Disclosure: The information provided in this article is not intended to give financial advice, recommend investments, guarantee profits, or shield you from losses. Our content is only for informational purposes and to help you understand the risks and complexity of these markets by providing objective analysis. Before trading, carefully consider your experience, financial goals, and risk tolerance. Trading involves significant potential for financial loss and isn't suitable for everyone.
