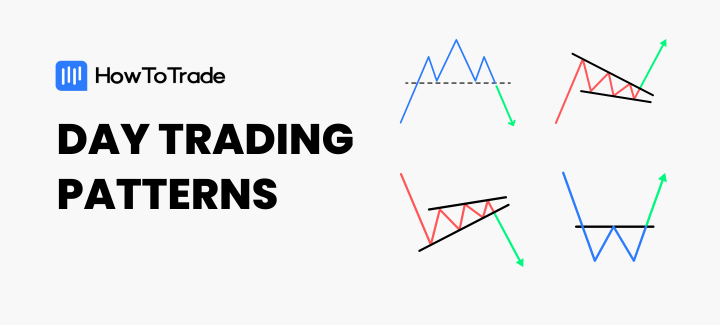
- Day trading patterns are valuable tools for identifying potential trading opportunities within a single trading day. Each pattern has a specific shape and formation that defines it.
- Many offer predefined trade entry and management rules that make them easy for beginners and experienced traders to use.
- While these patterns have some form of history of reliability, it’s important to only trade them within the context of the higher timeframe.
Day trading patterns are the “bread and butter” of many professional traders. Why? Because they are easy to spot, interpret, and trade. It makes trading easier for them. And when it comes to day trading patterns, there are so many of them.
In this piece, we’ll see 17 day trading patterns and how to use them in your trading.
 Table of Contents
What are Day Trading Patterns?
Day trading patterns are technical analysis tools used to identify potential trading opportunities within a single trading day. They are based on the analysis of price movements and can help traders identify possible trend reversals, continuations, or short-term price fluctuations.
Types of Day Trading Patterns You Should Know
There are two main ways to categorize chart patterns. The first is by the number of candlesticks it takes to form the pattern, and the other categorization is by the bias of the pattern.
Candlestick and Chart Patterns
Going by the number of candlesticks, a pattern can be a candlestick or a chart pattern. A candlestick pattern takes only a few candlesticks to form. Anywhere from 1 candlestick to 4 candlesticks. These patterns are a result of the observation of each candle to decode a short-term market sentiment.
On the flip side, a chart pattern takes a more wholesome/broad look at the chart to see what shape the candlesticks are forming, and they are made up of as many candlesticks as possible. With chart patterns, you don’t have to decode what each candlestick looks like. Instead, you try to see what shape the price has formed over time and how the price reacted in the past when it formed that shape. This way, you can predict where it’s likely to go next.
Reversal and Continuation Patterns
Going by its bias, a pattern can either be reversal or continuation. As the name suggests, reversal patterns indicate that a current is likely to reverse. So, if you were in a bullish trend and a reversal pattern appears, we are likely to see a reversal to a bearish trend. Traders use reversal patterns to predict the end of one trend and the beginning of another.
Continuation patterns, on the other hand, suggest that a current trend is likely to continue. Traders use these patterns to get into positions on established trends.
The Best Day Trading Patterns
Here are some of the most important day trading patterns out there:
1. Head and Shoulders / Inverse Head and shoulders
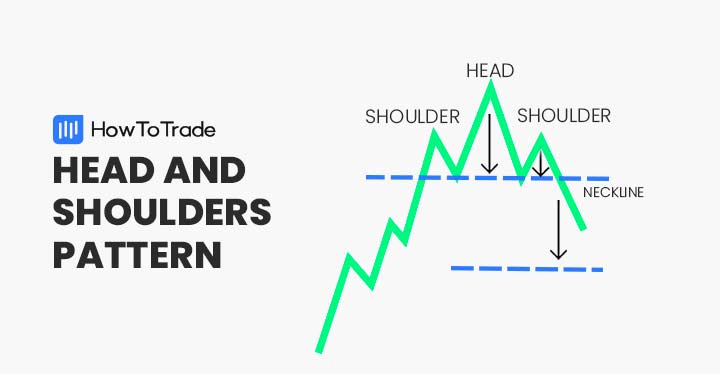
The Head and Shoulders pattern is a reliable bearish reversal pattern that occurs at the end of an uptrend. It consists of three peaks that form the shape of the head in the middle and two shoulders, with a neckline connecting the two lows.
An Inverse Head and Shoulders pattern is just like its Head and Shoulders counterpart, except that it’s flipped upside down. It is a bullish candlestick formation that occurs at the end of a downward trend and indicates that the previous trend is about to reverse. The pattern has three bottoms, with the middle bottom being lower than the first and third bottoms (the two shoulders).
When trading the head and shoulders pattern, you must wait for the price to break below the neckline before you enter a position. Your stop loss will be just above the right shoulder. And your profit target will be as wide as the distance between the neckline and the tip of the head. You enter trades on the Inverse Head and Shoulders in the same way, only in the opposite direction.
The good thing about the Head and Shoulders pattern is that it is reliable, and its entries and exits are well-defined. As a result, beginner day traders can easily pick it up for use.
Learn how to trade the Head and Shoulders and Inverse Head and Shoulders Pattern here:
2. Double Bottom and Double Top
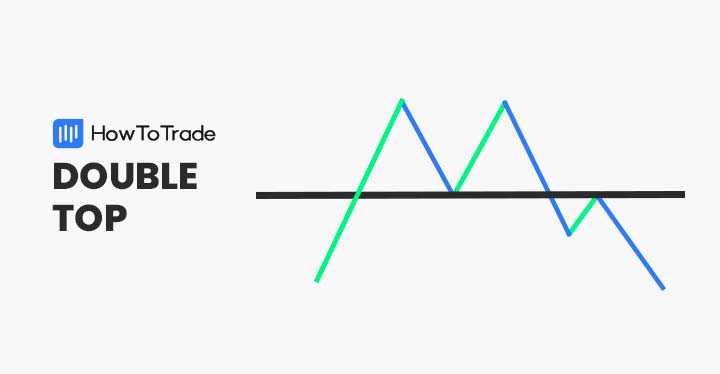
The Double Top and Double bottom patterns are reversal patterns that indicate the start of a bearish and bullish trend, respectively. They appear on the chart when an asset’s price forms two consecutive and relatively equal lows or highs, creating a “W” or “M” shape.
For clarification, the double top is the bearish reversal pattern, and the double bottom is the bullish reversal pattern.
Similar to the Head and Shoulders, a benefit of the double top and double bottom is that they are relatively reliable with clear entry and exit structures when used within the proper context.
To be able to trade the double top or double bottom pattern profitably, you must consider the broader market context and the specific characteristics of the asset you’re trading. You must do this before entering any position, as the pattern tends to fail when used out of context.
We take things to the next level with the Triple top/Triple bottom and the Quadruple bottom patterns:
3. Rising Wedge and Falling Wedge
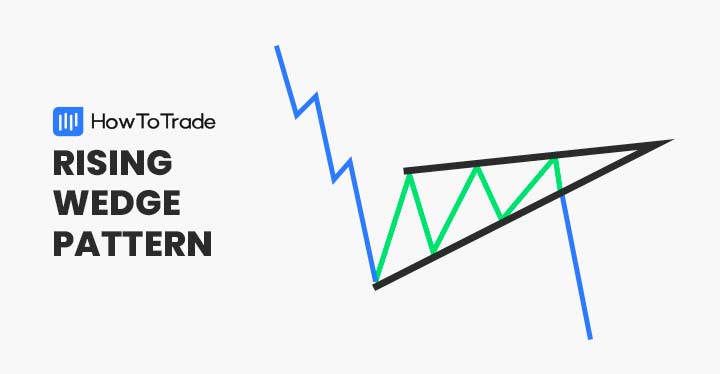
The rising wedge is characterized by price action confined within an upward-sloping trend channel. However, unlike a typical uptrend channel where the highs and lows keep rising, the rising wedge’s price channel has converging trend lines.
Similarly, the falling wedge forms as price action gets confined within a downward-sloping trend channel. Just like its rising counterpart, the trend channel is made of converging trendlines. In both cases, these converging trendlines signify weakening trends, potentially leading to a reversal.
The rising wedge and falling wedge patterns can be reversal or continuation patterns, depending on where they appear on the chart. If the rising wedge forms during an uptrend, we will likely see a downside reversal. However, if it forms during a downtrend, this might be a sign that the bearish trend will continue. On the flip side, a falling wedge in a bullish scenario may lead to a bullish continuation, but a falling wedge in a bearish scenario may lead to a bullish reversal.
Check out these posts where we do an indepth study of the rising and falling wedge patterns:
4. Descending Triangle and Ascending Triangle Patterns

The ascending triangle pattern is a bullish continuation pattern often appearing during an uptrend, while the descending triangle is a bearish continuation pattern often appearing during a downtrend.
The descending triangle pattern forms as price action gets confined within two trendlines; the lower trendline is horizontal, and the upper trendline slopes towards the lower trendline. Similarly, the ascending triangle is characterized by a horizontal upper trendline and a lower trendline that slopes towards the trendline above.
When either of these appears on the chart, we see it as the price taking a brief pause before it continues its trend before the appearance of the pattern.
As you may have noticed, the descending and ascending triangle patterns are very similar to the rising and falling wedge patterns. The main difference is that the former are mainly continuation patterns. The latter, on the other hand, can be used as either reversal or continuation patterns.
5. Symmetrical Triangle
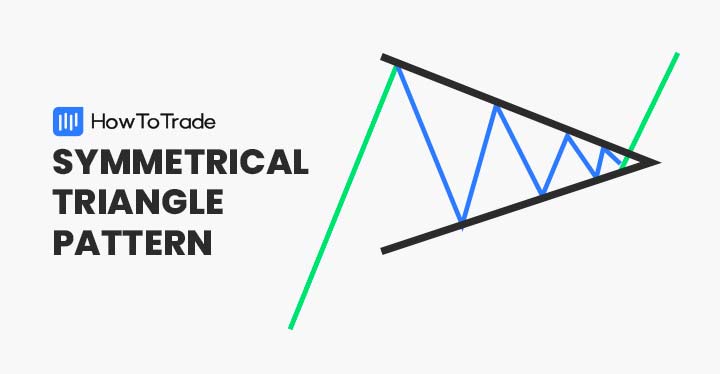
Very similar to the ascending and descending triangle patterns above is the symmetrical triangle pattern. The symmetrical triangle pattern is a trend continuation pattern that appears when the price briefly pauses its current trend before continuing. It is characterized by the confining of the price between two converging trendlines.
If the symmetrical triangle pattern appears in a bullish trend, we will likely see a breakout to the upside and a continuation of the bullish trend. Conversely, if the pattern appears in a bearish trend, we will likely see a bearish continuation.
6. Cup and Handle Pattern
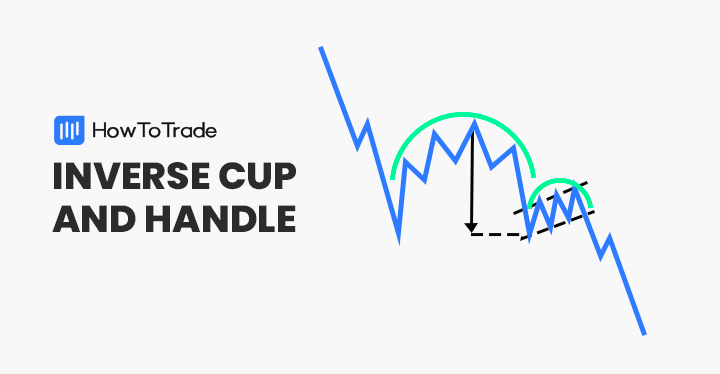
The cup and handle is a bullish reversal pattern that appears during an uptrend. It’s characterized by two distinct components:
- The cup resembles a “U” shape, formed by a price fall followed by a gradual bottoming out and then a rally.
- The Handle is a smaller bearish retracement following the cup, creating a handle-like shape on the right side of the pattern.
Similar to the cup and handle pattern is the inverse cup and handle pattern, which is just the direct opposite of the cup and handle pattern. So, instead of having a U shape for the cup, we have an inverted U shape. And instead of a short bearish retracement for the handle, we have a short bullish retracement.
While the cup and handle pattern suggests that the downtrend is losing momentum as buyers become increasingly active, the inverse cup and handle pattern suggests that the uptrend is losing momentum as sellers become increasingly active.
Something to note as you attempt to trade the (inverse) cup and handle pattern is that it’s most reliable at the end of a significant trend.
The Cup and Handle pattern can be a game changer for you if you know how to trade it. Let us show you:
7. Rounding Top/ Rounding Bottom
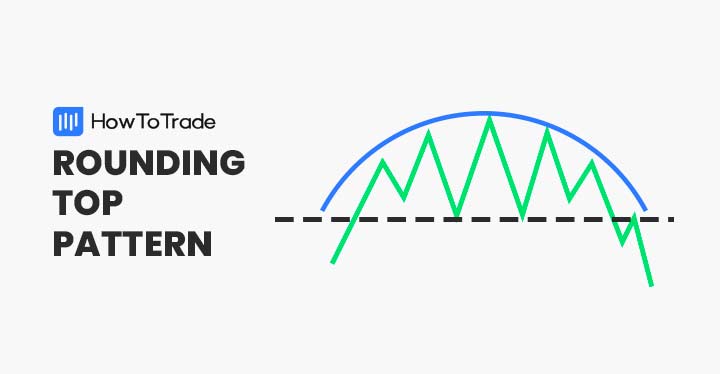
The rounding top and bottom patterns denote a gradual change in the direction of the trend. For the rounding top, which forms an inverted “U” shape, the likelihood is that the price is changing from bullish to bearish. It appears as the gradual slowing of a rally followed by an increase in the momentum of the decline.
The rounding bottom, on the other hand, denotes a reversal from bearish to bullish. On the chart, it’ll look like a series of price declines followed by a gradual bottoming out and a subsequent price increase, looking like a “U” shape.
Ideally, you want to use these patterns in longer time frames, and you can start looking to take trades as soon as the latest support or resistance breaks. Your stop loss in such a scenario will be on the outer side of the curve, and the depth of your U shape from your resistance or support can be your profit target.
If you want more information on how to trade the rounded top and bottom patterns, here you go:
8. Adam and Eve Chart Pattern
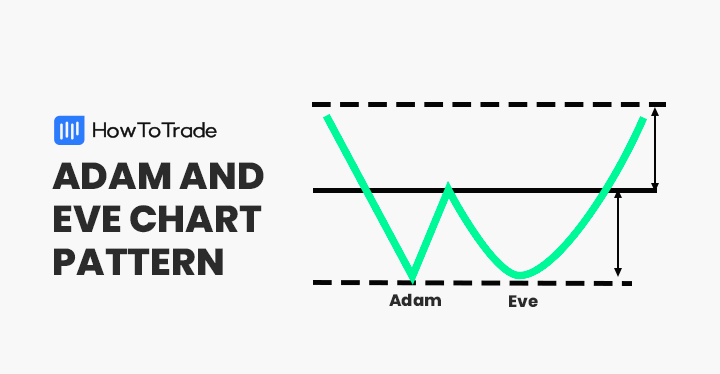
The Adam and Eve chart pattern signals a potential trend reversal that appears at the bottom of a downtrend. It appears on your chart as a sharp, V-shaped bottom (“Adam”) followed by a more gradual, rounded trough (“Eve”). As soon as you observe the formation of the “Eve,” you can start looking for long entries.
The opposite of the Adam and Eve pattern is the Inverse Adam and Eve, which is also a trend reversal pattern, only that it appears at the end of an uptrend to suggest a potential downtrend. As you might expect, you only take bearish trades with the inverse Adam and Even pattern.
The ideal trade entry style for the Adam and Even pattern is to buy or sell as soon as the price breaks the neckline. Your stop loss will then be below the pattern.
The Adam and Eve pattern is very easy to trade if you know what to look for. Let’s show you:
9. Island Reversal Pattern
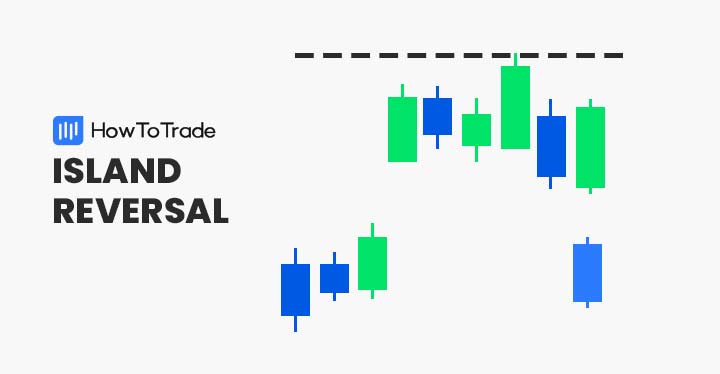
The island reversal is a powerful pattern that suggests a significant shift in market sentiment. It forms when two gaps on either side separate a group of candlesticks from the rest of the price action.
In a bullish Island Reversal, a downward trend leads to a gap, followed by a group of consolidating candlesticks, and then the upward gap. This upward gap signals the start of an uptrend. For a bearish Island Reversal, the pattern forms in an uptrend, with the second gap leading to a reversal downward. The first close of the candle after the second gap is where you place your trade.
This island reversal pattern is more common on the stock market charts and other markets where there isn’t a lot of liquidity. As a result, you may not see it on forex charts often.
Check the link below to learn more about the Island Reversal pattern and its trading strategies:
10. Diamond pattern
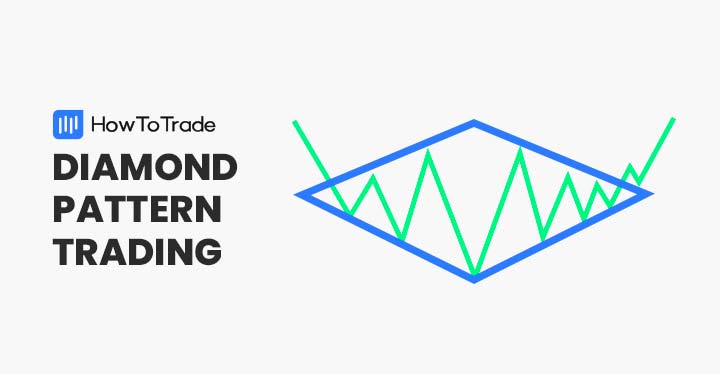
The Diamond Pattern is a reversal chart pattern that forms when price action creates broadening highs and lows, followed by a contracting range that forms a diamond shape. It often signals a trend reversal, typically appearing at market tops and bottoms.
This pattern is not the most common on the chart. It’s very rare. But when it does appear, it tends to be reliable. You simply enter your trade as soon as the price breaks out of the pattern in the opposite direction of the previous trend. Place your stop loss on the other side of the most recent swing high or low, and your profit target at the same distance between the lowest and highest points of the diamond pattern.
Learn how to trade the Diamond Reversal pattern here:
11. The Pennant Pattern
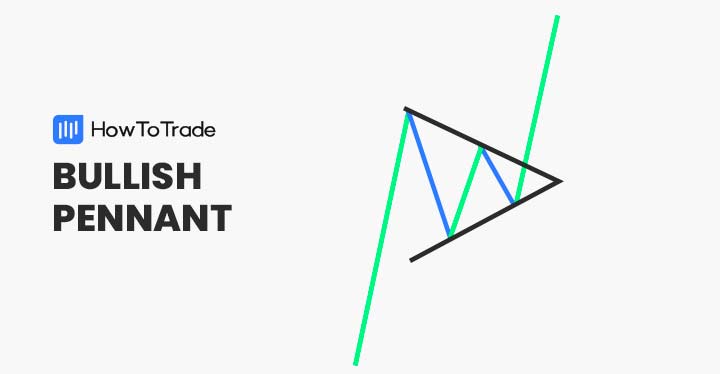
The Pennant Pattern is a continuation chart pattern that forms after a strong price move (either up or down), followed by a period of consolidation, and then a breakout in the same direction as the initial move.
A bullish pennant, for instance, starts with a rally, followed by a consolidation that looks like a triangle, and then the rallying breakout. Similarly, the bearish pennant pattern starts with a falling price, followed by a triangular consolidation, and the final falling continuation of price action.
Traders often use this pattern to capitalize on the momentum of a trend, and it is more reliable in high-volume markets.
Here’s a post that takes a deep dive into how to trade the Pennant pattern:
12. Morning Star and Evening Star

The morning star and evening star are three-candle reversal patterns that signal potential shifts in market sentiment. Traders rely on these patterns to identify potential trend reversals after a period of consolidation or a strong trend.
The morning star is a bullish reversal pattern that appears after a downtrend. It starts with a long, bearish candlestick, followed by a small, indecisive candlestick, and then a bullish candlestick that suggests that the market is no longer indecisive.
The evening star is a bearish reversal pattern that appears after an uptrend. It starts with a long, bullish candlestick, immediately followed by a small, indecisive candlestick. When the final decisive bearish candlestick comes, the evening star pattern is complete, and you can look to take bearish trades.
We have posts where we go into deeper details about the Evening Star pattern. Check them out:
13. Hammer and Shooting Star
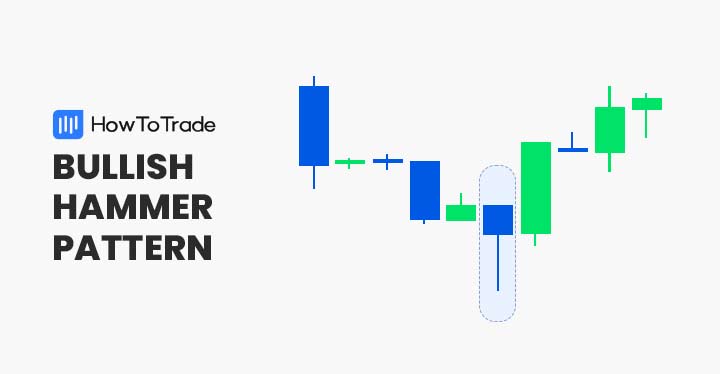
Although they are single candlestick patterns, they give a strong narrative of what the market is trying to do.
The hammer, for instance, is a bullish reversal pattern that appears after a downtrend. It appears on your chart as a candlestick with a long lower wick and a small body. The long lower wick suggests that there was strong selling pressure, but the small body indicates that buyers were able to push the price back up, implying a potential reversal.
If you want more information on how to trade the Hammer and Shooting Star patterns, here you go:
On the other hand, the shooting star is a bearish reversal candlestick seen after an uptrend. It has a small body and a long upper wick, indicating rejection of higher prices. The narrative behind this candlestick is that there was strong buying pressure before a stronger selling pressure came to suppress the price and send it back down.
Don’t place trades immediately you see the Hammer and Shooting star patterns. Wait for the formation of, at least, one more candlestick to get the full picture the market is trying to paint before executing trades.
14. Three Black Crows and Three White Soldiers

The three black crows and three white soldiers are three-candle continuation patterns that suggest a potential continuation of the existing trend. They appear as three strong candlesticks with the same bias following one another. The ones with the bullish bias are the white soldiers, and the ones with the bearish bias are the black crows.
Both patterns suggest strong buying/selling pressure and a continuation of the current trend.
Here’s a post that takes a deep dive into how to trade the Three Black Crows and Three White Solders pattern:
15. Harami Candlestick Pattern
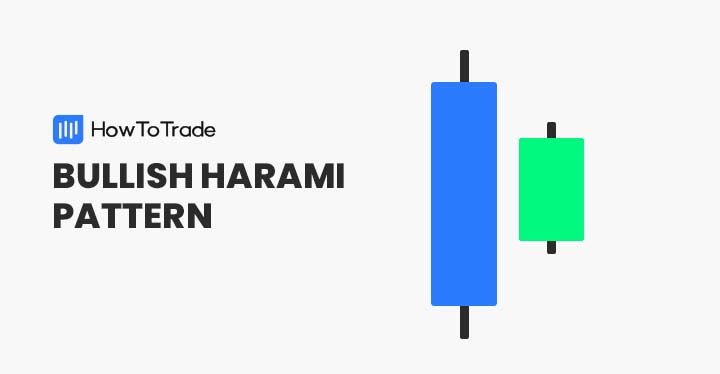
Harami translates to “pregnant” in Japanese, and that’s why the word is used to describe a two-candlestick pattern where the first is strong with a large body, but the second has a small body and forms within the range of the first. The pattern appears at the end of one trend to suggest a potential reversal.
The bullish Harami, for instance, starts with a long bearish candlestick that represents the continuation of the prevailing downtrend. However, the second candlestick that appears has its entire range within the range of the first candle, which is the first sign that the bears have run out of steam and the bulls may be about to take over from there. The same thing happens with the bullish Harami, only in the opposite direction.
The bias of the second candlestick doesn’t matter as much. It can be bullish or bearish. What matters is that a bullish harami is made up of a strong bearish candlestick followed by an indecisive candle within its range. Similarly, the bearish harami starts with a strong bullish candle followed by an indecisive candle within its range.
The Harami pattern is very easy to trade if you know what to look for. Let’s show you:
16. Abandoned Baby Pattern
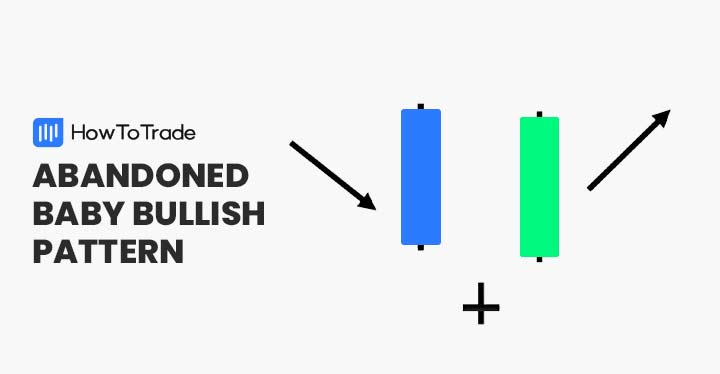
The abandoned baby pattern is a three-candle formation that can signal the end of a downtrend and the beginning of an uptrend. It comprises a long bearish candle, a Doji candle that gaps below the first candle, and a tall bullish candle that gaps above the second candle.
The abandoned baby is very similar to the island reversal pattern, with the only difference being that the abandoned baby is just one small candlestick. In contrast, the island is a group of consolidating candlesticks. If you check the abandoned baby pattern on a smaller timeframe, though, it’s likely to look like the island reversal.
Here’s a post that takes a deep dive into how to trade the Abandoned Baby pattern:
17. Bullish and Bearish Engulfing
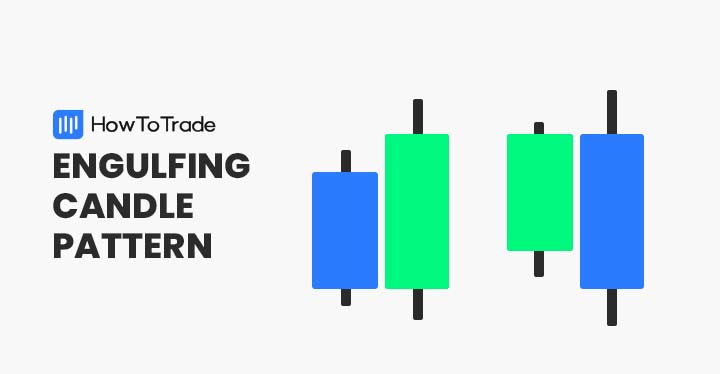
Engulfing patterns are two-candle reversal patterns. The pattern forms when one candlestick is significantly bigger than the previous candlestick of the opposite bias. For instance, the bullish engulfing candlestick comprises a small bearish candlestick followed by a significantly larger bullish candlestick. Similarly, the bearish engulfing candlestick is formed by a small bullish candlestick followed by a strong and significantly larger bearish candle stick.
If you want more information on how to trade the Engulfing Bar patterns, here you go:
When they appear, the trend is likely to change direction in the direction of the engulfing bar. However, we recommend waiting for confirmation before taking any trades using this pattern.
We have an entire section on our website where we deal thoroughly with each chart pattern and their trading strategies. You can check them out here:
The Free Day Trading Patterns PDF
If you need a free Day Trading Patterns PDF to take around with you, we’ve got you covered:
How Do You Apply Day Trading Patterns Profitably?
Day trading patterns can be a valuable tool for identifying potential trading opportunities. However, successful application requires a combination of knowledge, skill, and discipline.
1. Always wait for confirmation
Day trading patterns aren’t infallible. That’s why it is always important that you wait for confirmation before you take any trade. Without waiting for confirmation, you’ll notice that you get stopped out by false breakouts often.
2. Don’t trade a pattern against the overall bias
Regardless of how reliable a pattern might be, it makes absolutely no sense to trade it outside of the general context of the market buyers. This is one of the many mistakes beginners make when using day trading patterns. They take every pattern hook, line, and sinker without trying to see the full market picture on bigger timeframes.
3. Pick a handful of patterns and stick with them
Another way to profitably use day trading patterns is by picking only a handful and sticking with them. If you try to identify and trade all the day trading patterns you see on the charts, you’ll find that you’re making more mistakes and getting more trades wrong. Instead, focus on only a few day trading patterns and get very good at trading them before trying to add new patterns.
Risk Disclosure: The information provided in this article is not intended to give financial advice, recommend investments, guarantee profits, or shield you from losses. Our content is only for informational purposes and to help you understand the risks and complexity of these markets by providing objective analysis. Before trading, carefully consider your experience, financial goals, and risk tolerance. Trading involves significant potential for financial loss and isn't suitable for everyone.


