Are you familiar with the diamond pattern? How about diamond pattern trading? If not, don’t worry — this article will teach you the ins and outs of this powerful chart pattern.
- The diamond pattern is a critical chart formation that signals a potential reversal or continuation in market trends, typically appearing at the peaks or troughs of price movements
- Identifying the diamond pattern is crucial for traders; it’s characterized by a unique configuration of price movements that resembles a diamond shape, indicating a consolidation phase in the market.
- Successful navigation of this pattern can lead to well-timed entries and exits in the market, offering traders the opportunity to capitalize on the pattern’s predictive power while managing their risk exposure.
Read on to learn how to recognize, interpret, and trade the diamond pattern directly from your price charts.
What Is The Diamond Pattern?
The diamond pattern is a reversal indicator that signals the end of a bullish or bearish trend. It is most commonly found at the top of uptrends but may also form near the bottom of bearish trends.
This leads to two distinct diamond patterns: the bullish diamond pattern and the bearish diamond pattern. Forex traders view the diamond top and bottom as potential trading opportunities.
Accordingly, each pattern suggests a possible chance to buy or sell a market.
How to Identify The Diamond Pattern in Trading?
The diamond pattern is visually discernable due to its diamond shape. It appears similar to the head and shoulders pattern. Below is an example of the diamond top on a GBP/USD chart.
Below is the process by which diamond chart patterns are utilized in forex:
- Identify a prevailing upward or downward trend.
- Construct the chart pattern from a period of sideways price action.
- Draw two trend lines that connect periodic highs and lows.
- Draw two trend lines that connect periodic lows and highs.
- Search for a bullish or bearish market entry.
Bullish Diamond Pattern
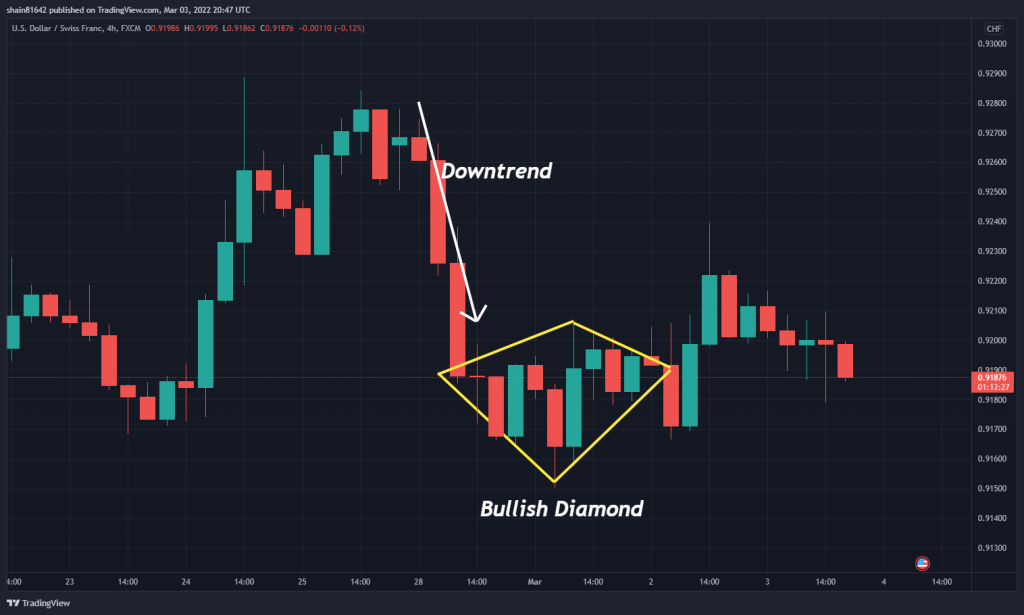
The bullish diamond pattern occurs after a strong downward move in price. It consists of two resistance levels that constrain previous retracements and two support levels that have constrained the downtrend.
Also known as the diamond bottom pattern, the bullish diamond pattern signals a buying opportunity. Often it is the precursor for a bullish breakout. The chart below gives us an example of a bullish diamond.
Bearish Diamond Pattern
The bearish diamond formation develops after a robust uptrend in price. It is comprised of two support levels that constrain previous retracements and two resistance levels that have checked the bullish trend.
Also known as the diamond top pattern, this formation is a signal to sell to the market. The chart below is an example of this diamond formation.

Diamond Chart Pattern Trading Strategy
It is fairly simple to trade forex using the diamond bottom or diamond top formation. All you need to do is determine market entry, locate your stop loss, and select a viable profit target. Then, the trade execution process is streamlined.
1. Market Entry
Diamond patterns are reversal indicators that project a pending bullish or bearish breakout. Thus, one buys or sells the market according to whether the diamond formation occurs at the bottom of a downtrend or the top of an uptrend.
- One sells beneath the diamond top formation.
- One buys above the diamond bottom formation.
In this way, you can take long or short positions using diamond patterns.
2. Stop Loss
Generally, one locates the stop loss above the upper or below the lower extreme of the diamond pattern. This is done as follows:
- One places a stop loss above the diamond top pattern.
- One places a stop loss below the diamond bottom pattern.
The exact stop loss location for diamond patterns may vary. Some practitioners place stop losses above or below the upper or lower extreme of the diamond. Others view the opposing trendline as being an excellent reference.
3. Profit Target
Setting a profit target using the diamond top or diamond bottom is relatively straightforward. Typically, one aims for a profit target equal to the height of the diamond formation itself.
However, there is some leeway in the arena of profit targets. Many traders choose to apply a static risk vs. reward ratio instead of using height as a reference.
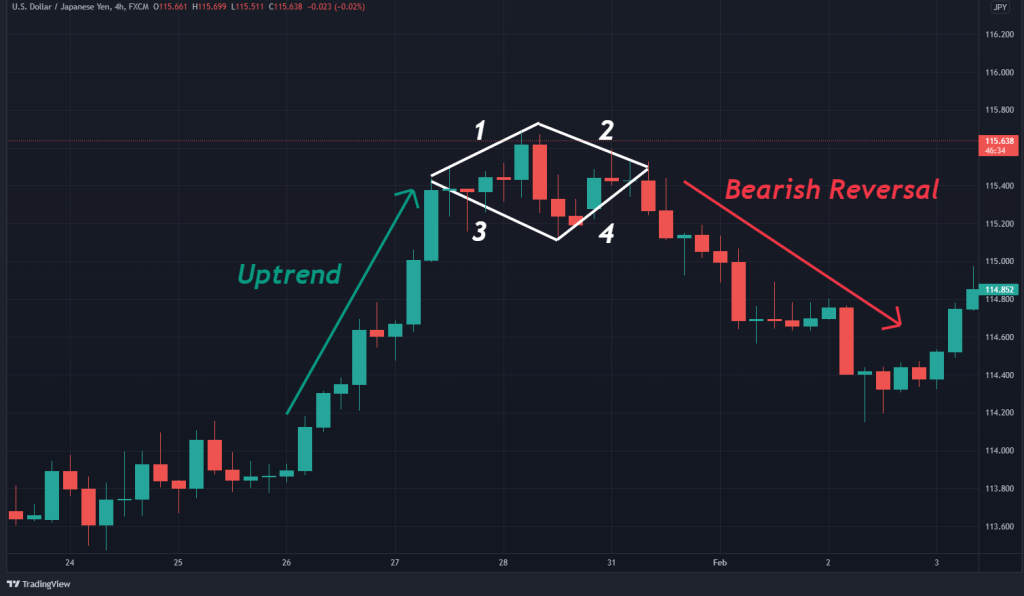
Trading Example
Trading a bullish or bearish diamond chart pattern is a straightforward process. The USD/JPY example below outlines the procedure from top to bottom.
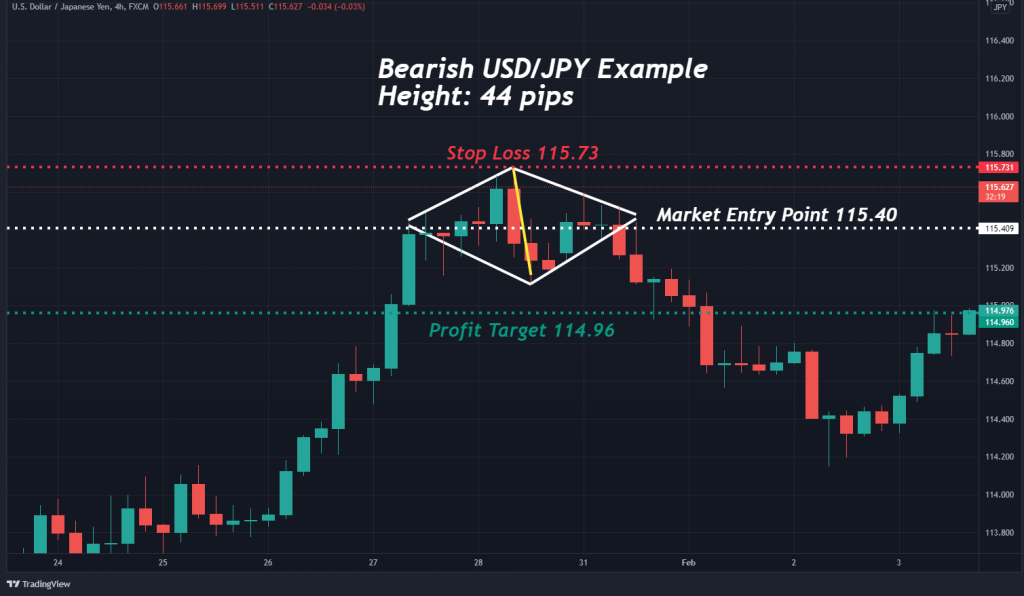
Here’s how the trade above was executed:
- The prevailing uptrend was identified.
- A diamond top was constructed.
- A sell order was entered beneath the pattern at 115.40.
- A stop loss was placed above the pattern at 115.73.
- The profit target was located at 114.96, a 1:1 ratio with the diamond’s height.
- The take profit was hit, generating a 44 pip gain.
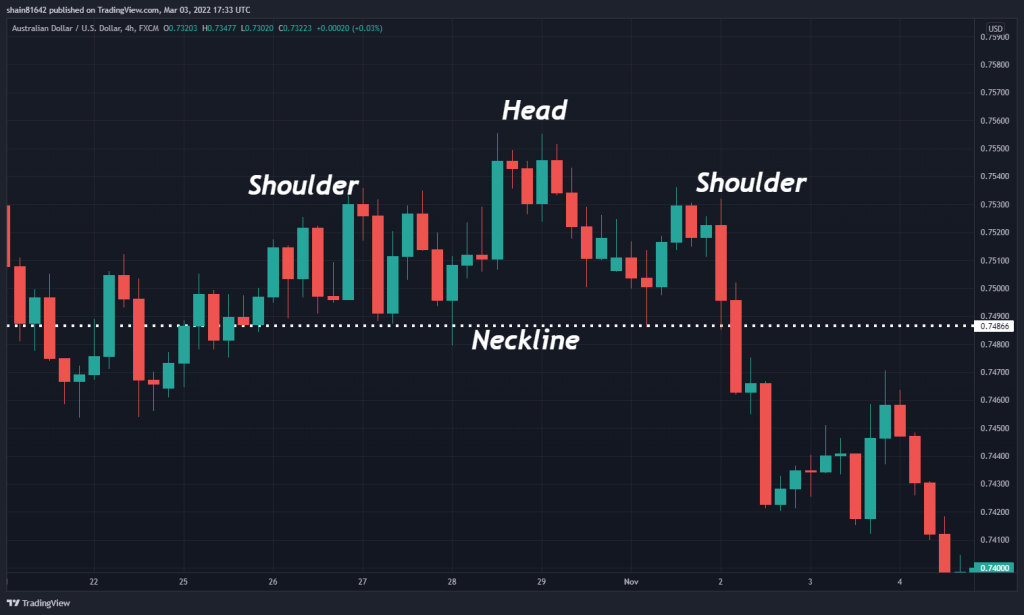
Diamonds Vs. The Head And Shoulders Pattern
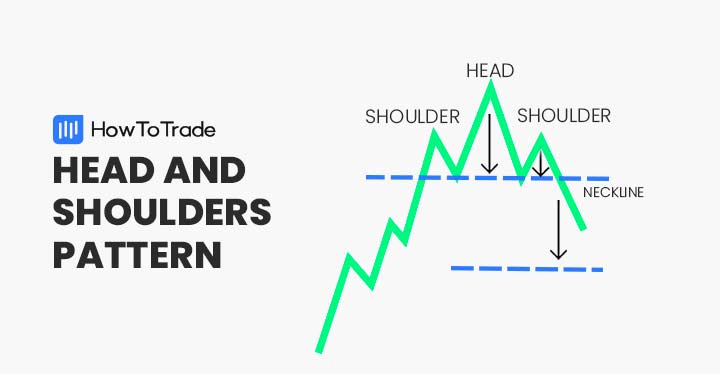
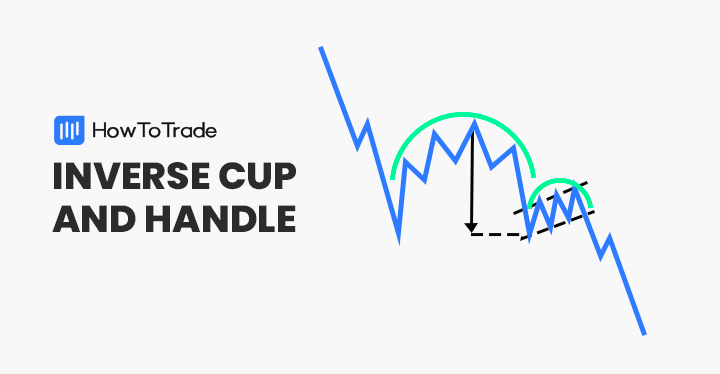
Visually, the diamond formation and head and shoulders chart pattern are similar. In that sense, a bullish diamond pattern is similar to the inverted head and shoulders chart pattern.
However, it’s important to note that diamonds may form at the top of an uptrend or the bottom of a downtrend. Head and shoulders patterns are local to the upper quadrants of a bullish trend.
Diamond tops and head and shoulders patterns are bearish indicators. Each gives the trader a way to sell or short the market. The chart below is a good illustration of the head and shoulders pattern.
Diamond Patterns — Pros and Cons
Every technical indicator has a collection of advantages and disadvantages. The following is a look at a few key pros and cons of diamond patterns.
Pros
- It frequently occurs in all forex pairs on all timeframes
- Offers buy and sell market entries
- Works well with reversal trading strategies
Cons
- It can be difficult to construct
- Loses efficacy on shorter time frames
- May produce false signals
Everything About the Diamond Chart Pattern in One Video
Check this video for more information on how to trade the harmonic Gartley chart pattern.
Key Takeaways
In conclusion, here are the key takeaways about the diamond pattern:
- Diamond patterns are constructed of two support and two resistance trendlines. They occur amid uptrends and downtrends.
- A diamond top is a bearish indicator that produces a selling opportunity. A diamond bottom is a bullish indicator that produces a buying opportunity.
- Diamond pattern trading is straightforward. Market entry consists of buying above a bullish diamond or a sell below a bearish diamond. Stop losses are located above a bearish diamond and below a bullish diamond. Profit targets may be placed according to the pattern’s height or standard risk vs. reward ratios.
Diamond Chart Pattern FAQs
The following are a few of the most frequently asked questions regarding diamond formations.
Is the diamond chart pattern bullish or bearish?
The diamond chart pattern is considered a neutral pattern, which means it is neither bullish nor bearish on its own. Rather, the direction in which the breakout occurs from the pattern is what determines whether it is a bullish or bearish signal.
Which is more accurate: diamond tops or diamond bottoms?
No. One pattern is not inherently better than the other. Each can be a powerful way of spotting market reversals.
Are diamond formations reliable reversal indicators?
Yes. Nonetheless, no pattern, indicator, or technical tool is infallible. Be sure to implement prudent risk management when diamond trading.
Risk Disclosure: The information provided in this article is not intended to give financial advice, recommend investments, guarantee profits, or shield you from losses. Our content is only for informational purposes and to help you understand the risks and complexity of these markets by providing objective analysis. Before trading, carefully consider your experience, financial goals, and risk tolerance. Trading involves significant potential for financial loss and isn't suitable for everyone.