The Inverse Cup and Handle pattern has been around since 1988 when William Neil described the pattern in his book, “How to Make Money in Stocks.” Since then, the chart pattern has certainly become among the most popular chart patterns in technical analysis.
- The Inverse Cup and Handle pattern has become a cornerstone in technical analysis.
- Recognized for its bearish signals, this pattern is a harbinger of potential market downturns when identified correctly.
- Mastery of this pattern in forex trading requires a keen eye for its distinct characteristics and nuances.
This guide will discuss everything you need to know about the Inverse Cup and Handle chart pattern. Here, we will explain the basics of the inverted cup and handle chart pattern and show you how to use it correctly.
- What is the inverse cup and handle candlestick pattern?
- How to identify and use the inverse cup and handle candle pattern in forex trading?
- How to trade forex using the inverse cup and handle candlestick pattern – Strategies and examples
- The inverse cup and handle pattern – Pros and cons
- Key takeaways
- Frequently asked questions (FAQs)
What is the Inverse Cup and Handle Chart Pattern?
The Inverse Cup and Handle pattern, also referred to as the upside-down cup pattern, is a bearish reversal pattern that appears during an uptrend. Technically, the price declines when a new high is formed, resulting in an inverted cup shape before reverting higher and creating a shape of the handle (also known as the saucer).
Take note that the Inverse Cup and Handle is the opposite version of the Cup and Handle pattern, which appears during a downtrend and is a bullish chart pattern. Both of them are among the most popular and widely used classical chart patterns. The pattern is considered valid when the price closes below the neckline support level (the top of the cup).
However, while this pattern is straightforward, you should be careful when entering a trade and use other tools to confirm the breakout. Like other trend reversal patterns, false breakouts can occur during this pattern formation, so patience and extra confirmation are crucial when trading with the inverted cup and handle pattern.
Take note that, generally, the inverted cup and handle pattern can be either a reversal or continuation pattern, depending on the location and context.
How to Identify the Inverse Cup and Handle Chart Pattern in Trading?
So, now that you know what the Inverse Cup and Handle pattern is, let’s find out how you can identify the chart pattern on a price chart. But first, let’s get back to the foundations of the formation.
William Neil, the founder of the cup and handle pattern, suggested that the pattern is made of a saucer (cup) followed by a consolidation (handle). The saucer indicates a surge in demand, while the consolidation stage refers to a continuation section. Price breakouts from the handle indicate downward momentum.
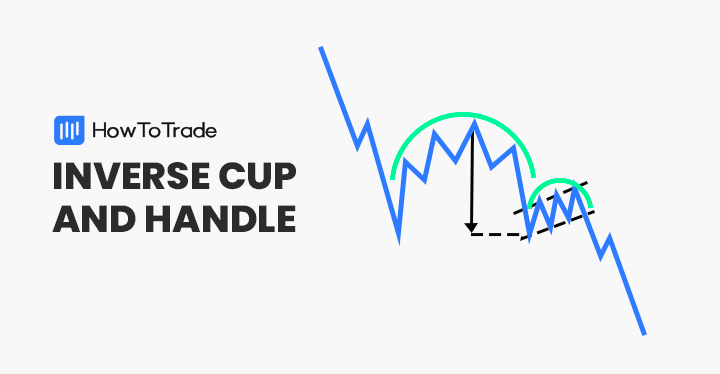
The good thing with this chart pattern is that the name hints at what you need to look for, which is an inverse cup and handle formation. So, here is what the inverted cup and handle pattern looks like on a price chart:
As you can see, the inverse cup and handle pattern consists of two main parts – cup and handle. Then, as soon as the price breaks below the cup’s support neckline, the chart pattern is valid, and a bearish sell signal is made.
That said, there are several factors to consider when identifying the inverse cup and handle pattern:
- Trend – There must be an uptrend for the Inverse Cup and Handle to act as a bearish reversal signal.
- Shape – The shape of the pattern should resemble an inverted cup or inverse U.
- Length – William mentioned that the longer the cup, the bigger the price reversal movement when the cup breaks below the neckline.
- The greater the handle’s length, the greater the projected price move at breakout.
- The price retracement that forms the handle should not reach into the lower half of the cup. For that matter, it is useful to add a Fibonacci Retracement tool to validate the length of the handle. .
- The Breakout – The price breaks out when it reaches the neckline support level of the cup; most traders use this price level as the entry point.
How to Trade the Inverse Cup and Handle Chart Pattern – Trading Strategies
There are many ways to trade the inverted cup and handle pattern; however, in this section, we will show two effective methods to trade with the inverse cup and handle chart pattern – reversal and breakout.
1. Breakout Trading Strategy
The first way to trade the inverse cup and handle pattern is to look for a trend direction reversal. As the chart pattern indicates a bearish trend reversal, your goal is to enter a short position immediately after identifying this unique formation.
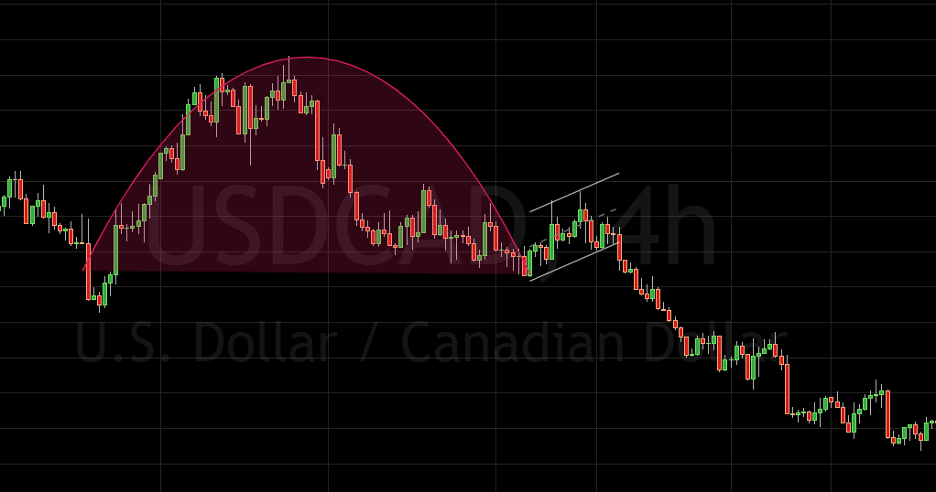
Let’s see an example. The below GBP/USD daily chart shows an Inverse Cup and Handle pattern from February 2022 to September 2022. The currency pair was trading in a bullish channel from March to June. Then, the price dropped, creating a perfect formation of the cup. In the last step, the price increased again, forming the handle – completing the Inverse cup and Handle chart formation.
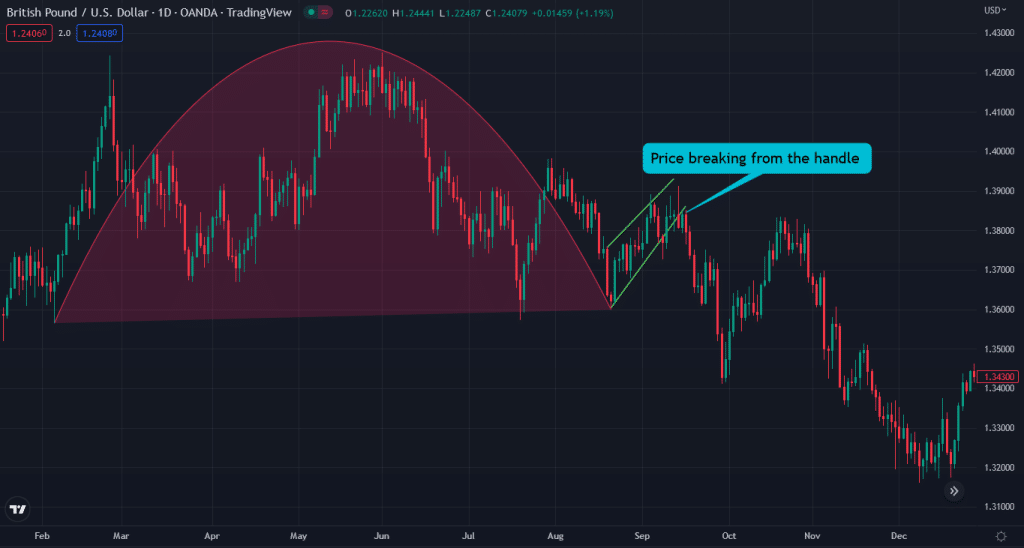
As you can see in the chart above, after the price broke below the neckline of the inverse cup pattern, the GBP/USD fell sharply.
So, based on the breakout strategy, when you identify the inverse cup and handle pattern with a short handle – you enter a short-selling position only when the price breaks below the neckline. However, as previously mentioned, you must confirm the reversal with other trading tools. For example, you can use technical indicators, support and resistance levels, and trading volume indicators to get extra confirmation that a reversal is likely to occur.
A stop-loss order could be placed at the highest level of the previous price swing. Finally, take profit price target is placed at the next Fibonacci level.
2. Reversal Trading Strategy
The second way to trade the Inverse Cup and Handle is by looking for a reversal, which is pretty similar to the first method. As we have explained in the first method, the most convenient way is to wait for the price to break the cup’s neckline.
However, some traders take a position even before, exploiting the handle’s price movement as well. They simply enter a short sell position whenever they identify the completion of the cup and the beginning of the handle shape price movements.
Let’s see an example.
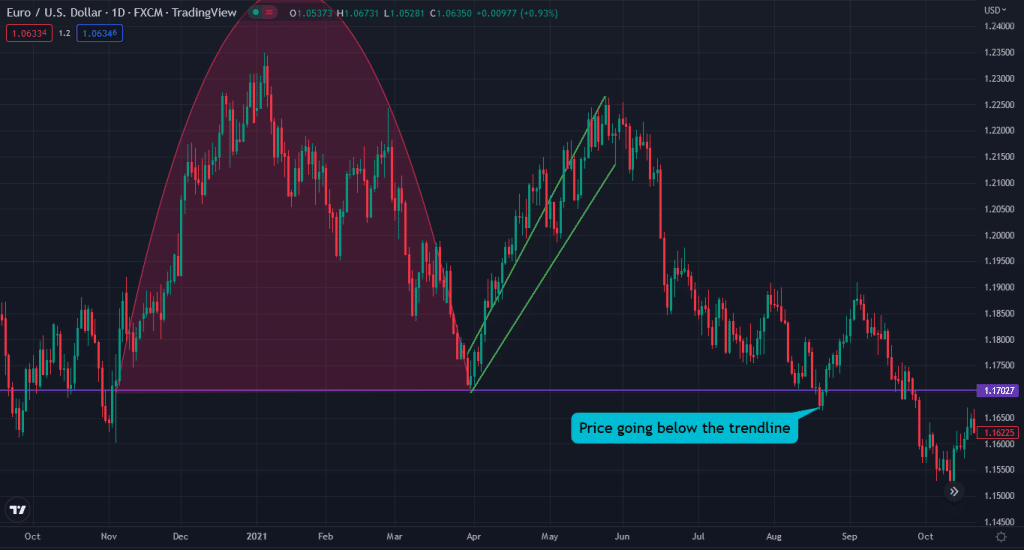
The above EUR/USD daily chart shows an inverse cup and handle pattern. However, in this case, the handle length is significant. Based on this strategy, the cup and handle chart formation is already valid, which means you can enter a short-selling position aiming for a retest at the cup’s neckline support level.
Furthermore, according to this strategy, a stop loss could be placed at the highest level of the cup, and a take profit is placed at the neckline or lower.
The Inverse Cup and Handle Chart Pattern – Pros and Cons
Every pattern has pros and cons, including the inverted cup and handle pattern. So, let’s take a quick look at the pros and cons of using the inverse cup and handle chart formation.
Pros
- The pattern is easy to spot
- The Inverse Cup and Handle help traders to accurately find price reversals
- A great chart formation to identify price breakouts
- It may be seen as either a reversal or continuation pattern
Cons
- The pattern appears in perfect formation very rarely
- Sometimes the pattern can create false breakouts
Key Takeaways
Check the top key takeaways from trading the inverse cup and handle pattern below.
- The Inverse Cup and Handle is a chart pattern resembling a formation of an inverted cup or inverse U
- The pattern is a bearish reversal pattern that forms during an uptrend and signals a shift in market sentiment
- The inverted cup and handle pattern can be either a reversal or continuation pattern
- The pattern starts the formation in an uptrend, creates the top, then reverses back to complete the saucer (cup). The price rises again and forms the handle before breaking below the cup’s neckline
- When trading with the pattern, you can take short positions when the price reverses from the handle or when the price breaks from the lower trendline
Frequently Asked Questions (FAQs)
Here are some of the most frequently asked questions about the inverse cup and handle pattern in forex:
Is Inverse Cup and Handle bullish?
No, the Inverse Cup and Handle is a bearish pattern that signals the end of an uptrend and the beginning of a new downward trend. When this pattern appears, the price typically makes a long bearish move after the price reversal.
What happens after the Inverse Cup and Handle chart pattern?
After the inverse cup and handle’s completion, the price moves downward. You can enter short positions after the breakout from the lower trendline or after price reversal from the handle. Otherwise, it is also an excellent signal to exit a long position. Generally, the inverted cup and handle pattern helps traders profit from downward price movements if used correctly.
Can the inverse cup and handle pattern work intraday?
Absolutely. Even though many consider the cup and handle patterns best for medium to long-term strategies such as the swing trading strategy, they also work on shorter timeframes.
Risk Disclosure: The information provided in this article is not intended to give financial advice, recommend investments, guarantee profits, or shield you from losses. Our content is only for informational purposes and to help you understand the risks and complexity of these markets by providing objective analysis. Before trading, carefully consider your experience, financial goals, and risk tolerance. Trading involves significant potential for financial loss and isn't suitable for everyone.