A shooting star candlestick pattern is a bearish formation in trading charts that typically occurs at the end of a bullish trend and signals a trend reversal. It is a popular reversal candlestick pattern that occurs frequently in technical analysis and is simple and easy to identify.
In this article, we are going to cover all the basics you need to know in order to start using and identifying the shooting star candlestick pattern.
- What is the shooting star candlestick pattern?
- How to identify and use the shooting star candlestick pattern?
- How to trade the shooting star candlestick pattern?
- The shooting star candlestick pattern – Pros and cons
- Shooting Star Candlestick Pattern (VIDEO)
- Key takeaways
- Frequently Asked Questions (FAQs)
What is the Shooting Star Candlestick Pattern?
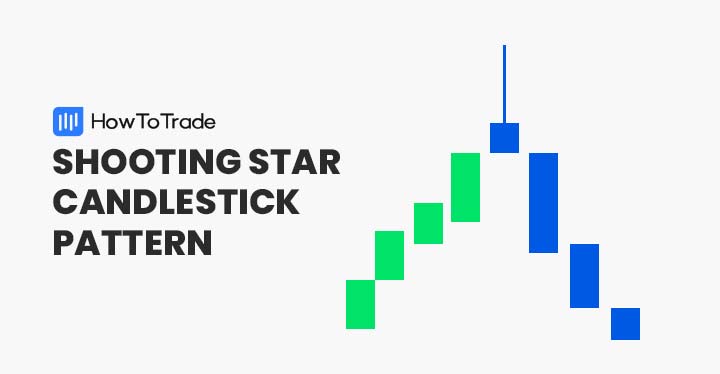
A shooting star candlestick is a unique charting pattern that comes at the end of an uptrend and indicates a potential trend top area followed by a trend reversal. This bearish reversal candlestick has a long upper shadow, little (or no) lower shadow, and a small body.
Unlike the famous Doji candlestick pattern that indicates indecision between buyers and sellers – the shooting star pattern portrays a market condition where buyers can no longer push prices higher and face a strong resistance level.
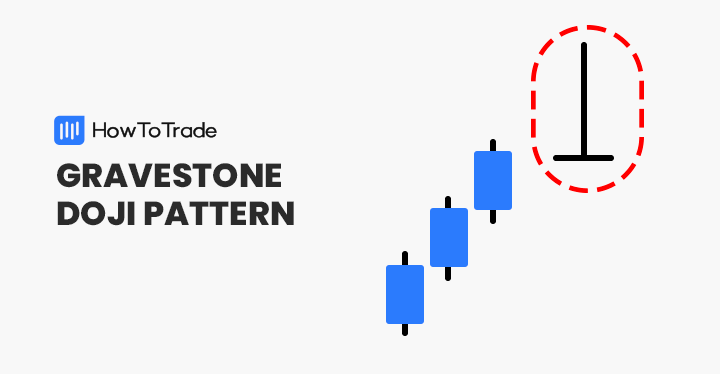
In terms of its structure, the shooting star candle has a long upper shadow and a very small shooting star’s body, meaning the trading range between the opening price and the closing price is narrow. It has a very similar structure as the Gravestone Doji candlestick pattern, though the latest has no body, meaning the opening and closing price are the same.
The shooting star candle looks exactly the same as the bullish hammer pattern and the inverted hammer candlestick pattern, however, the difference between these pattern two is that they occur in different market scenarios. While the first two patterns appear at the end of a downtrend, the shooting star occurs at the end of a bullish trend and is, in essence, a top reversal pattern.
How to Identify and Use the Shooting Star Candlestick Pattern?
As with any other technical analysis candlestick patterns, you must know how to correctly identify the shooting star pattern in order to use it as part of your trading strategy.
Luckily, identifying the shooting star pattern is simple and straightforward – basically, you need to find a candlestick pattern that has a long upper shadow, short or no lower shadow at all, and a really small body.
For those of you who are not familiar with candlestick patterns, we suggest you visit our Japanese Candlestick Chart Pattern course.
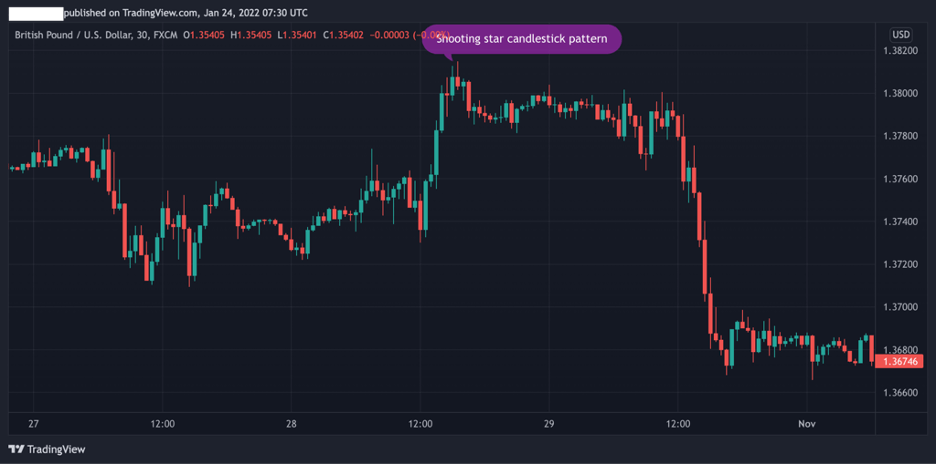
Still, with a quick look at a trading chart, you’ll be able to understand what the shooting star candlestick pattern looks like. As you can see, in the GBP/USD 30-min chart below, the shooting star pattern appears after an uptrend and indicates a price reversal of the current trend.
Then, when buyers face strong resistance, the market reverses and a bearish downtrend starts.
Taking the above chart into account, there are several steps you need to follow in order to effectively identify and trade the shooting star candlestick pattern.
- Identify a bullish uptrend
- Find a candlestick pattern at the top of the uptrend with a long upper shadow, short lower shadow, and small body
- Wait until the price reverse and use other technical analysis tools to confirm the trend reversal (RSI and MACD)
- Enter a short sell position
- Set a stop-loss order above the highest price of the shooting star candlestick
How to Trade the Shooting Star Candlestick Pattern?
Trading the shooting star candlestick can be very effective but also a bit tricky. After all, you are entering a position against the market trend with the goal of ‘catching’ a trend reversal.
This is why confirmation is needed and you have to use other momentum technical indicators. Two of the most important trend reversal indicators are the RSI and MACD indicators. So, below, we are going to show you how to confirm a shooting star trend reversal with these tools.
1. Relative Strength Index (RSI) and Shooting Star Candlestick Pattern
The relative strength index is one of the most simple to use trend reversal indicators in technical analysis. It’s basically a momentum technical indicator that measures the changes in the asset’s price movements and signals if the market is in an overbought or oversold condition.
When the RSI rises above 70, then the market is essentially in overbought mode and a bearish trend reversal is expected. When the RSI falls below 30, then the market is in an oversold condition and a bullish trend reversal is likely to happen.
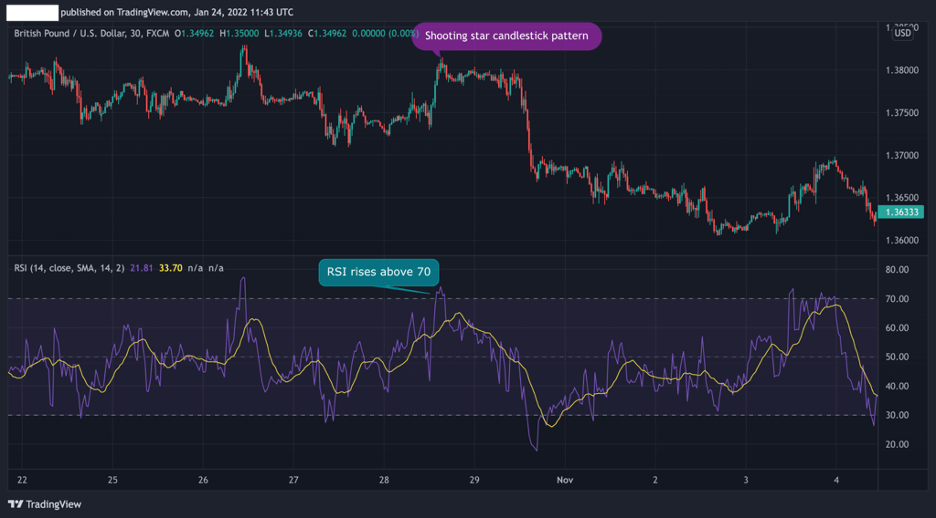
As you can see in the GBP/USD chart – at the exact time the shooting star candlestick appears, the RSI rises above 70 and the pair indeed enters a bearish trend.
2. Moving Average Convergence Divergence (MACD) and Shooting Star Candlestick Pattern
Another momentum technical analysis tool that can be helpful in confirming a trend reversal is the moving average convergence divergence or MACD. For those unaware, the MACD basically measures the difference between two exponential moving averages and gives users a good indication of when the market is expected to change a trend direction.
This means that when you add the MACD indicator to a trading chart, you’ll be looking for a crossover around the same price area where the shooting star candlestick pattern occurs.

As you can see in the example above, the MACD crossover did not happen in the exact price level of the shooting star candlestick. Instead, the crossover was confirmed a few candles later, which eventually signaled a trend reversal.
With the MACD confirmation and the shooting star pattern – a selling position should be made with a stop loss above the highest level of the shooting star candlestick.
The Shooting Star Candlestick Pattern – Pros and Cons
These are the most common pros and cons of trading the shooting star candlestick pattern:
Pros
- A simple candlestick pattern to identify
- Very reliable technical analysis indicator
- Stop loss placement is easy to spot (SL should be placed above the highest level of the shooting star candle)
- Works well with other momentum indicators – RSI and MACD
Cons
- The shooting star pattern must be confirmed with other technical analysis tools
- A risky trade as the trader basically sells the asset at the top of a trend
Everything About the Shooting Star Candlestick Pattern in One Video
Watch this video to learn how to identify and trade the shooting star candlestick pattern.
Key Takeaways
In short, here are the key takeaways:
- A shooting star is a unique candlestick pattern that appears after an uptrend and signals a bearish trend reversal
- In terms of the characteristics of the pattern – The shooting star reversal pattern has a long upper shadow, short lower shadow, and a small real body.
- When trading the shooting star pattern, confirmation is needed. Two technical indicators that may help in confirming a trend reversal include the RSI and MACD.
- A stop loss should be placed above the highest level price of the shooting star candle
Risk Disclosure: The information provided in this article is not intended to give financial advice, recommend investments, guarantee profits, or shield you from losses. Our content is only for informational purposes and to help you understand the risks and complexity of these markets by providing objective analysis. Before trading, carefully consider your experience, financial goals, and risk tolerance. Trading involves significant potential for financial loss and isn't suitable for everyone.