Chart patterns are a crucial part of technical analysis as they give traders a powerful tool to view the price movements of any asset and identify repetitive geometrical shapes.
These patterns can be made of two, three, four, five, and even more candlesticks; however, a single candlestick pattern is made of just one candle. And, ironically, these one-candle patterns are among the most accurate and reliable chart patterns out there.
Use this page to find out how to identify, and trade each single candle pattern.
What are Single Candlestick Patterns?
As the name suggests, single candlestick patterns are chart formations made of just one candlestick. Unlike a line chart or a bar chart, a Japanese candlestick chart provides more information and is often seen by traders as the most effective trading tool. They are recognized as patterns because they tend to predict bullish and bearish future price movements.
For those who are not familiar with the term, a candlestick is a way in technical analysis to display the information of an asset. This includes the high, low, open, and closing prices for a specific period.
For example, a daily candlestick shows the open, high, low, and close price for a specific asset for one day. Other time frames than the daily ones include long-term time frames (weekly, monthly, yearly) and short-term time frames (4-Hour, 2-Hour, 1-Hour, 30-Min, 15-Min, 10-Min, 5-Min, and 1-Min).
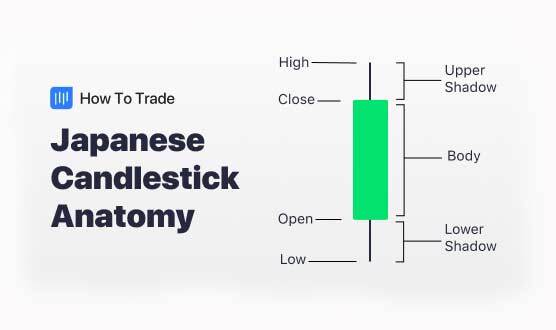
As you can see, a Japanese bullish candle formation shows the upper and lower shadows, opening and closing prices, and trading range in the specific time frame (candlestick body).
One crucial factor to consider when using a single candle pattern is that you should always incorporate it in conjunction with other technical analysis tools to confirm the signal and ensure you enter into a profitable trade. These tools will help you determine the buying or selling pressure behind market moves.
You combine technical indicators like Moving Averages, the Relative Strength Index (RSI), Moving Average Convergence Divergence (MACD), and the Stochastic Oscillator for trend reversal candle patterns.
Additionally, one of the most powerful indicators to combine, either in trend reversal patterns or continuation patterns, is Fibonacci Retracement support and resistance levels.
What are the 12 Most Common Single Candlestick Patterns?
Single candlestick patterns are certainly essential and can bring lots of trading opportunities for you. Typically, single candle patterns indicate a possibility for a trend reversal, although in some cases, it can indicate the continuation of the existing trend like the inside day candle pattern.
Each Single candlestick pattern has a bearish and bullish version and can be found in different scenarios on candlestick charts.
The most well-known single candle pattern is the Doji candlestick. However, there are other commonly used and important single candlestick patterns you must consider in trading. Those are:
1. Doji Candle Pattern

The Doji candlestick pattern is a single-candle chart pattern. Dojis occurs when a candle’s opening is near-to or the same as its close. They resemble a “+” sign with a small body with defined upper and lower wicks. Dojis come in several varieties with fascinating nicknames. A few of the most popular are the Long-legged Doji, Gravestone Doji, and the Dragonfly Doji candlestick pattern.
The Doji comes into the market when there’s indecision in the market. The bulls are unable to muster enough volume to push the price in their way, neither do the bears. So, the period ends with an indecision.
2. Shooting Star Candlestick Pattern
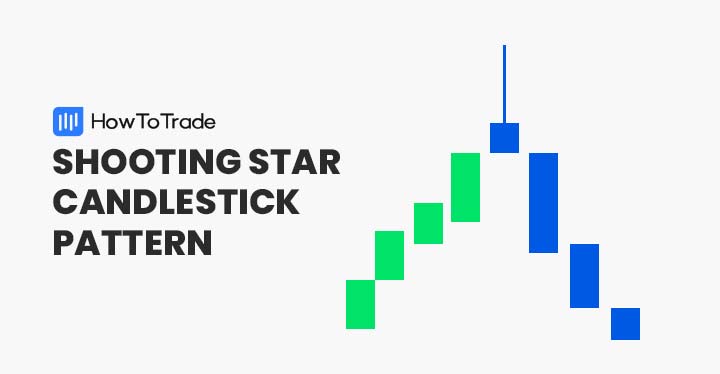
A shooting star candlestick pattern is a bearish reversal pattern that typically occurs at the end of a bullish trend and signals a trend reversal. It is a popular reversal candlestick pattern that occurs frequently in technical analysis and is simple and easy to identify.
3. Long-Legged Doji Candlestick Pattern
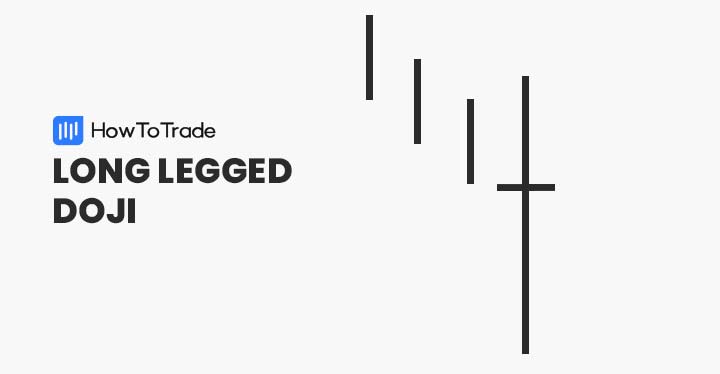
The long-legged Doji is a Japanese candlestick pattern that signals market indecision. It consists of a single candle with long wicks and exact or approximate opening and closing prices.
4. Marubozu Candle Pattern
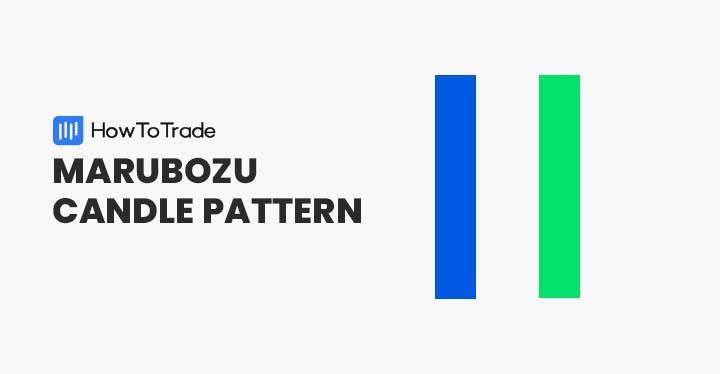
The marubozu candle pattern can be best described as a momentum candlestick pattern. For traders, it usually serves as a leading indicator that the price is expected to continue in a certain direction without any resistance. It appears as a strong bullish candlestick or a strong bearish candlestick, each with barely any wick.
5. Spinning Top Candlestick Pattern
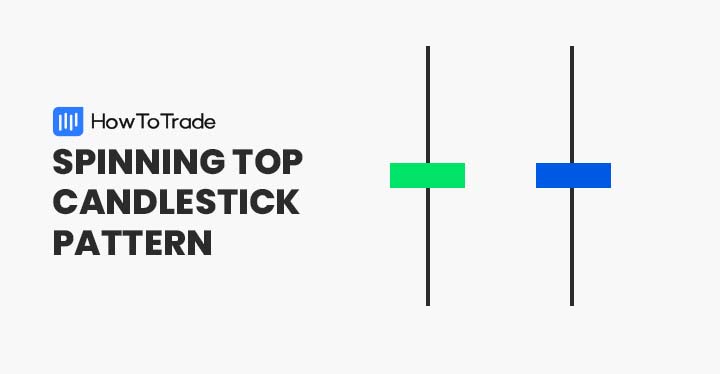
The spinning top is a candlestick pattern that signals indecision between buyers and sellers and may indicate a possible trend reversal. It is another common and effective candlestick reversal pattern used by Traders to find trading opportunities and market trends.
6. Doji Star Candle Pattern
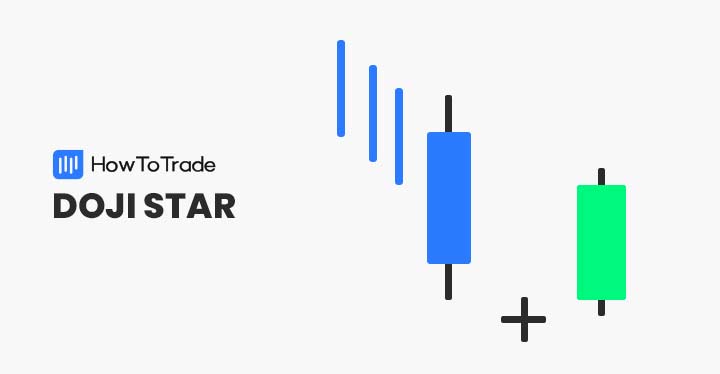
The Doji star candlestick pattern is a three-candle reversal formation (although it may be considered as a single candlestick pattern). It consists of a large bullish or bearish candle, Doji, followed by another large bullish or bearish candle. Concerning the other candles, the Doji develops after the pricing gap is up or down…
7. Evening Star Pattern

The evening star pattern is a reversal indicator that signals the end of an uptrend. The evening star consists of three consecutive candles: a large bullish candle, a Doji candlestick, and a large bearish candle. Traders consider evening star patterns to be bearish reversal indicators. When the formation develops on a candlestick chart, it is perceived as a signal to sell a currency pair.
8. Bullish Harami Candlestick Pattern
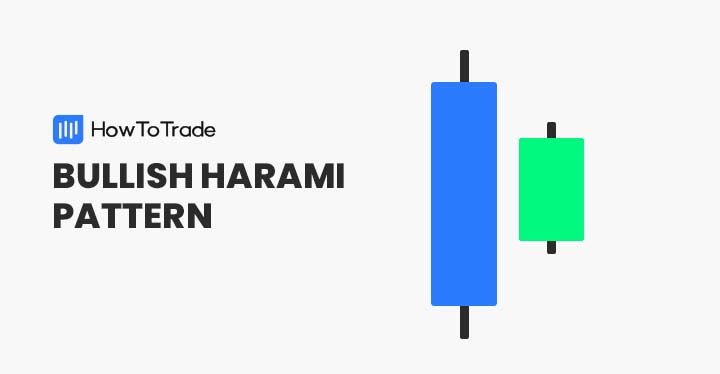
The bullish harami candle pattern is a Japanese candlestick formation formed at the bottom of a bearish trend and indicates that the trend is about to reverse. In appearance, the pattern consists of two candles one after the other with the first bearish candle having a long body and short upper and lower wicks and the second bullish candle having a very small body.
9. Inverted Hammer Candlestick Pattern
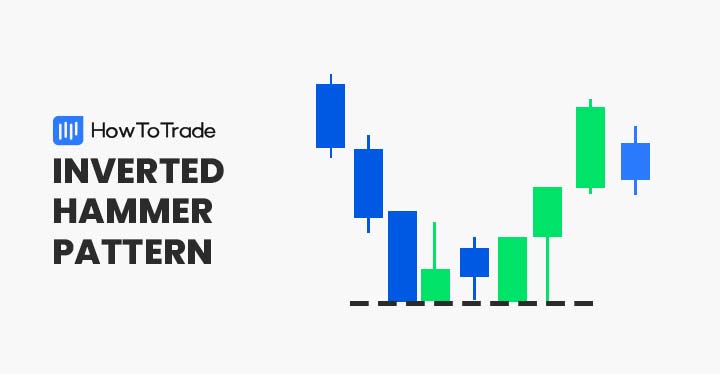
The inverted hammer is a bullish candlestick pattern that occurs at the bottom of a downtrend and may indicate that the market price is about to reverse. In its appearance, the inverted hammer candle looks exactly like an upside-down hammer and the opposite version of the bullish hammer candlestick pattern. Additionally, it has the same structure as the shooting star candlestick pattern.
10. Pin Bar Candlestick Pattern
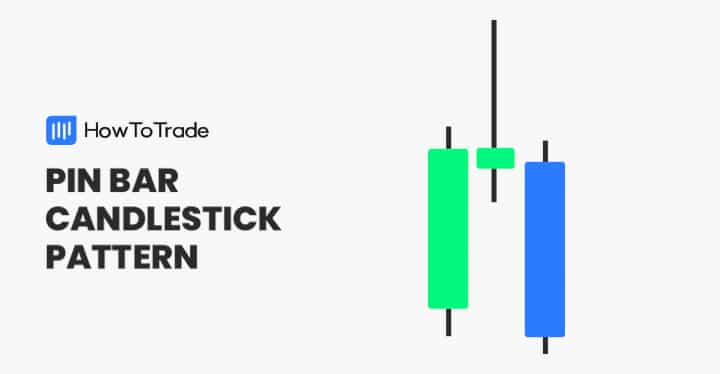
The pin bar is a single candlestick pattern having a long wick and a small body that helps traders find entry and exit levels. Interestingly, the pin bar is short for Pinocchio Bar. Martin J. Pring, an expert technical analyst, was the first to name the pattern pin bar.
11. Doji Evening Star Pattern
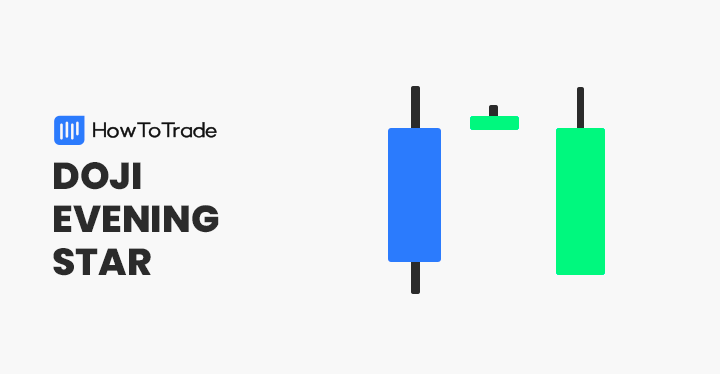
The Evening Doji Star pattern, which is the opposite version of the morning star candlestick pattern, is a three-candle pattern that appears at the end of an uptrend and indicates that the existing is likely to end. It consists of three candles; a bullish first candle, followed by a Doji evening star, and finally, a bearish third candle. When the last candle appears, it signifies a change in trend.
12. Doji Morning Star Pattern
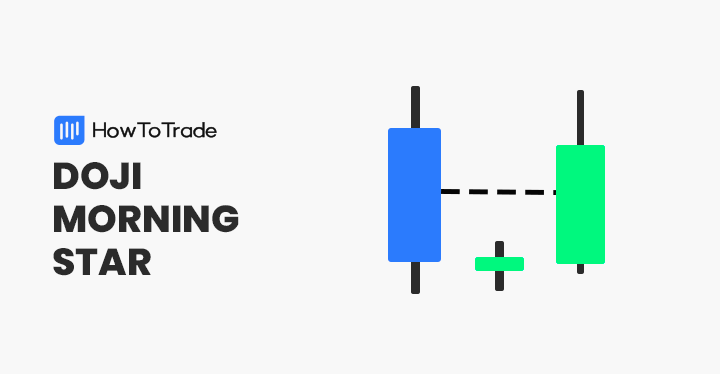
The idea behind the Doji Morning Star is that the bearish momentum is about to end, and the bulls will take charge soon. Typical bullish reversal pattern. It is the opposite version of the Evening Star candle pattern that appears at the end of an uptrend and signals a bearish trend reversal.
The Free Single Candlestick Patterns PDF
If you need something to easily carry around and refer to when it comes to Single Candlestick Patterns trading strategy, this PDF is for you:
Risk Disclosure: The information provided in this article is not intended to give financial advice, recommend investments, guarantee profits, or shield you from losses. Our content is only for informational purposes and to help you understand the risks and complexity of these markets by providing objective analysis. Before trading, carefully consider your experience, financial goals, and risk tolerance. Trading involves significant potential for financial loss and isn't suitable for everyone.