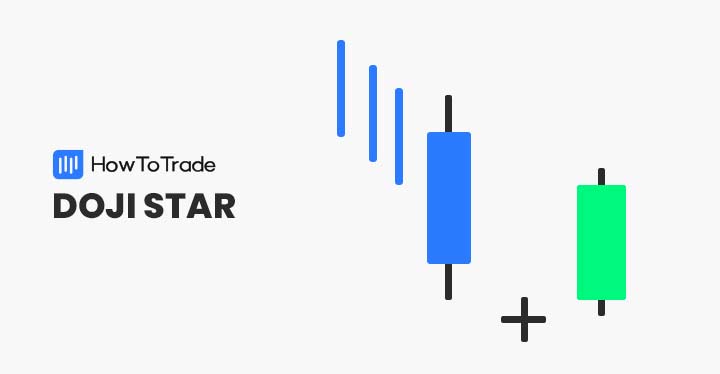
The Gravestone is a one-candle pattern and part of a group of candlestick patterns known as Dojis. Usually, the pattern appears at the end of an uptrend and has a bearish bias.
However, in some cases, the gravestone candle pattern can occur at the end of a downtrend and may signal a bullish reversal.
- The Gravestone Doji is a bearish reversal candlestick pattern typically found at the top of uptrends, signaling potential downward market shifts.
- This pattern is characterized by a long upper shadow and a small or nonexistent lower shadow, indicating a significant rejection of higher prices.
- Traders use the Gravestone Doji to identify potential selling opportunities, particularly when it appears after a sustained price increase and is confirmed by subsequent bearish candles.
Either way, the gravestone Doji candle is a trend reversal pattern you must know. Read on to learn how to identify, and trade the Gravestone Doji pattern in the forex market.
- What is the Gravestone Doji Candlestick Pattern?
- How To Identify the Gravestone Doji Candle Pattern?
- Gravestone Doji Candlestick Pattern Trading Strategies
- The Gravestone Doji Pattern – Pros and Cons
- What is the Difference Between a Shooting Star and a Gravestone Doji Candle Pattern?
- What is the Difference Between a Dragonfly Doji and a Gravestone Doji Candle Pattern?
- Key Takeaways
- Frequently Asked Questions
What is the Gravestone Doji Candlestick Pattern?
The Gravestone Doji is a single candlestick pattern that signals a trend reversal. It is one of the different types of the famous Doji candlestick pattern and is usually formed at the end of an uptrend. Traders and investors generally use this chart pattern to identify price reversal and enter a position at the beginning of a new trend.
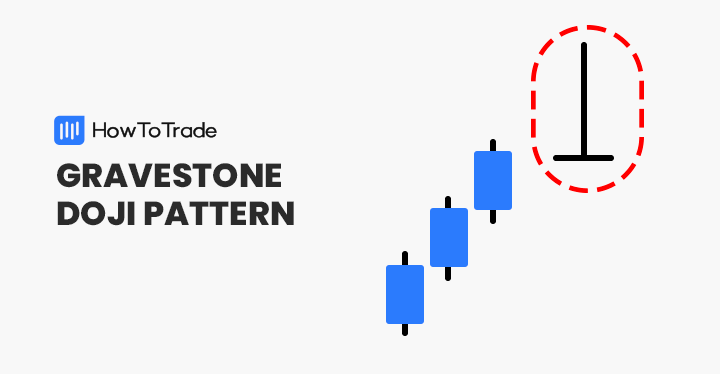
In terms of its structure, the gravestone pattern is characterized by the same open, low, and closing prices with a long upper shadow that indicates buyers cannot push prices above a certain level.
In addition, it is similar to the dragonfly Doji and has an inverted T letter, which suggests that buying or selling pressure stops.
How to Identify the Gravestone Doji Candle Pattern in Trading?
Generally, identifying the Gravestone Doji candle pattern is pretty straightforward. It is a single candle pattern that appears at the end of an uptrend or downtrend and has the same open and close price and a long upper shadow.
So, let’s see an example of the gravestone Doji candle pattern on a live price chart.
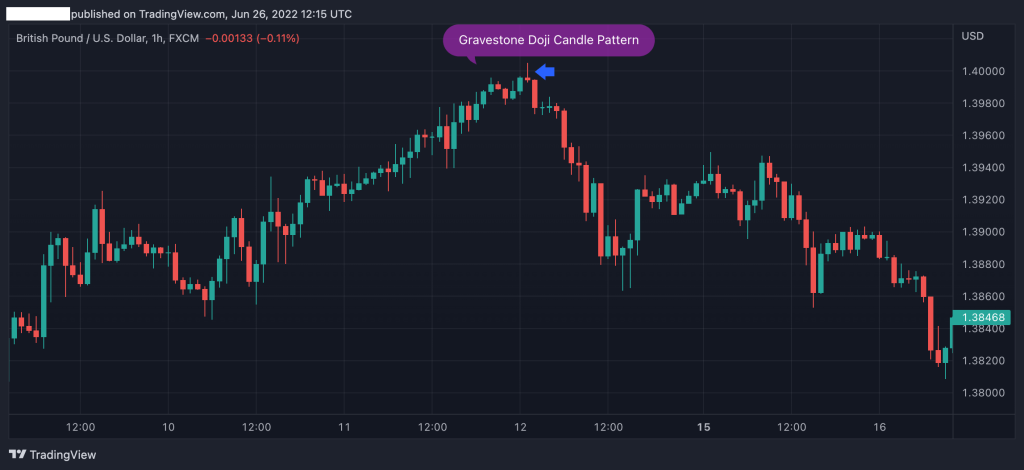
As you can see in the GBP/USD 1H chart above, the gravestone Doji appears at the end of an uptrend with pretty much the same opening price and closing price and a long upper shadow.
Then, as soon as the next candle closes below the closing price of the gravestone candle, a trend reversal is likely to occur, and a new bearish trend begins.
Taking the above into consideration, here’s what you need to keep in mind to identify and use the gravestone Doji candlestick pattern:
- Identify the gravestone candle chart formation
- Use technical indicators to confirm the trend reversal
- Enter a trade once the following candle closes below (or above) the gravestone candle’s closing price
- Set a stop-loss at the highest (or lowest) level of the gravestone candle
- Set a take profit target at the next Fibonacci retracement level
Gravestone Doji Candlestick Pattern Trading Strategies
Trading the gravestone candle pattern is straightforward to understand. As a trend reversal indicator, traders are looking to enter a position when the gravestone candle is completed, and the following candle signals that the market is about to reverse.
Yet, as we mentioned earlier, you must confirm the gravestone pattern with other indicators to maximize the chances of success and know exactly where to enter and exit the position.
Further, as explained above, the gravestone candlestick pattern can be either bullish or bearish, meaning you’ll have to know how to identify this pattern in both market scenarios.
Below, we will show you the two trading strategies with examples and add the necessary technical analysis tools to help you learn how to confirm the trend reversal.
1. Bearish Gravestone Doji Candle Pattern
The standard version of the gravestone Doji candle pattern is bearish. Typically, traders use this pattern to enter a short-selling position or exit an existing long position. As expected, the bearish gravestone Doji candle pattern appears at the top of an uptrend and indicates that the market trend is about to change.
The example below shows how the bearish gravestone Doji forms at the top of a trend and signals a selling opportunity on a GBP/USD 1-hour chart. To confirm the pattern’s bearish reversal signal, we used RSI and MACD – two of the most popular and effective momentum indicators.
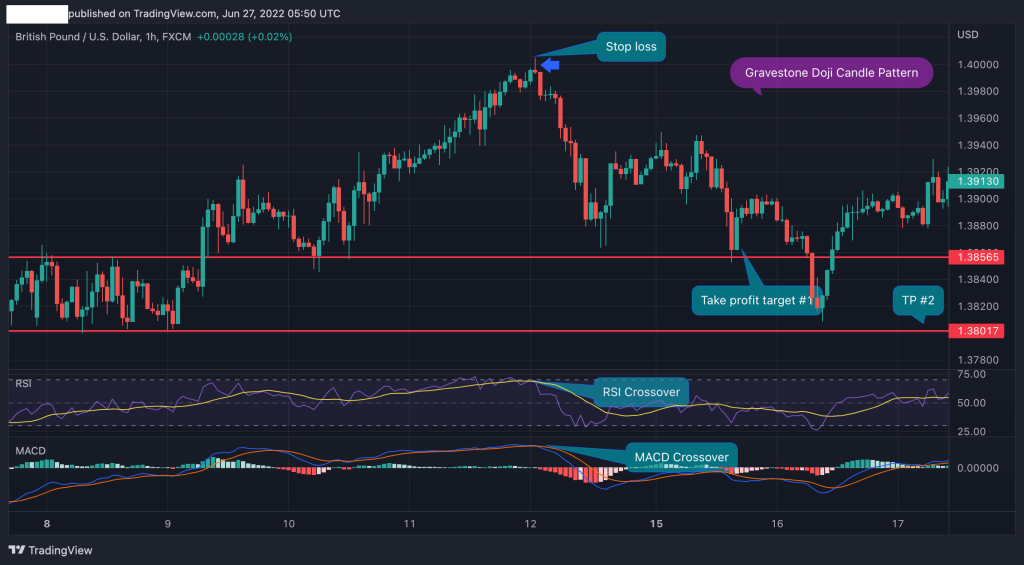
Both the RSI and MACD indicators confirm the trend reversal. But the most critical indicator, in this case, is the next candle that is strongly bearish and offers a powerful signal for a trend reversal.
Further, when trading the bearish gravestone candle pattern, your stop loss should be placed above the highest level of the gravestone candle. The take profit level is placed at the following support levels.
2. Bullish Gravestone Doji Candle Pattern
Unlike the bearish gravestone Doji candle pattern, the bullish version is considered less reliable. This is because the price bounced back up but finished the candle at the lowest level.
As such, it could be a trend reversal indicator or a trend continuation signal. To ensure it is a reversal signal, we added the Relative Strength Index (RSI) indicator and the Moving Average Convergence Divergence (MACD).

As you can see in the GBPUSD 1-hour chart above, the Gravestone Doji chart pattern appears at the bottom of a downward trend and signals the end of the bullish sentiment.
Once again, as soon as the next candlestick closes above the gravestone candle, the trend changes and the price rises again. In this case, a stop loss is placed below the lowest level of the bearish trend, and take profit is placed at one of the previous price swing peaks.
That said, you must confirm that the indicator and the price movement indicate the same, otherwise, there’s a divergence. To learn more about divergences, we suggest you download our divergence cheat sheet.
The Gravestone Doji Pattern – Pros and Cons
Here are the top pros and cons of trading the gravestone Doji pattern:
Pros
- Easy to spot on trading charts
- Very reliable indicator
- Clear SL and TP levels
Cons
- Traders should combine other indicators to confirm the gravestone candle pattern
- A risky trade at the bottom of a downward trend
Finally, here are the key takeaways from this article.
- The gravestone Doji candle is a bearish or bullish trend reversal single candlestick pattern
- The pattern can be either bearish or bullish, though it is usually used as a bearish trend reversal indicator
- In terms of structure – the gravestone candle has the same open and close price and a long upper shadow
- When trading the gravestone candle pattern, it’s best to use other technical analysis indicators to confirm the reversal
- Traders enter a position once the next candle closes above (or below) the gravestone candlestick
- Stop-loss is placed above (or below) the gravestone Doji candle. TP is placed at the next price peak of the previous trend
What is the Difference Between a Shooting Star and a Gravestone Doji Candle Pattern?
The shooting star and the gravestone Doji candle are a single candlestick pattern that indicates a trend reversal and has a similar chart formation. Yet, there’s one difference between the two – while the gravestone candle has no body (or tiny body), the shooting star candlestick pattern has a body, and the open and close prices are not the same.
Market-wise, the shooting star shows a stronger rejection of higher prices compared to the gravestone doji. It’s a more definitive bearish signal because the candle closes lower than it opened, confirming that sellers have already started to take control by the end of the session.
What is the Difference Between a Dragonfly Doji and a Gravestone Doji Candle Pattern?
The gravestone doji is a bearish reversal pattern that often appears at the top of an uptrend. It’s characterized by a long upper shadow, a very small body (where the open and close are nearly the same), and little to no lower shadow.
On the flip side, the dragonfly doji is a bullish reversal pattern typically seen at the bottom of a downtrend. It has a long lower shadow, a small body (again, where the open and close are nearly identical), and little to no upper shadow
Another key difference is the market context in which each appears. Gravestone doji typically appears at the top of an uptrend, signaling a bearish reversal. Dragonfly doji shows up at the bottom of a downtrend, indicating a bullish reversal.
Frequently Asked Questions about the Gravestone Doji Pattern
Here are some of the most frequently asked questions about the gravestone candle pattern in forex trading:
Can a Gravestone Doji candle pattern be bullish?
Yes, it can. If the gravestone Doji candle pattern appears at the end of a downtrend, then it indicates that sellers cannot push prices lower, and a bullish trend reversal is likely to happen.
How do you trade a Gravestone Doji candlestick pattern?
Traders use the gravestone Doji candle pattern as a bearish trend reversal indicator. Therefore, when you identify a gravestone candlestick at the top of an uptrend, you should wait for the next candle to close below the gravestone candle’s lowest level and enter a short-selling position. Further, to confirm the trend reversal, you should use other momentum indicators such as the RSI, MACD, and Fibonacci support and resistance levels.
How reliable is the Gravestone Doji pattern?
The Gravestone Doji is quite reliable when used in the proper context. For instance, a gravestone doji in a bullish trend, suggesting a bearish reversal, is more reliable than the same pattern in a bearish trend, signaling a bullish reversal. Also, if the former is supported by more technical analysis concepts, such as resistance levels, Fibonacci levels, and even indicators such as RSI and MACD, the reliability increases.
Risk Disclosure: The information provided in this article is not intended to give financial advice, recommend investments, guarantee profits, or shield you from losses. Our content is only for informational purposes and to help you understand the risks and complexity of these markets by providing objective analysis. Before trading, carefully consider your experience, financial goals, and risk tolerance. Trading involves significant potential for financial loss and isn't suitable for everyone.