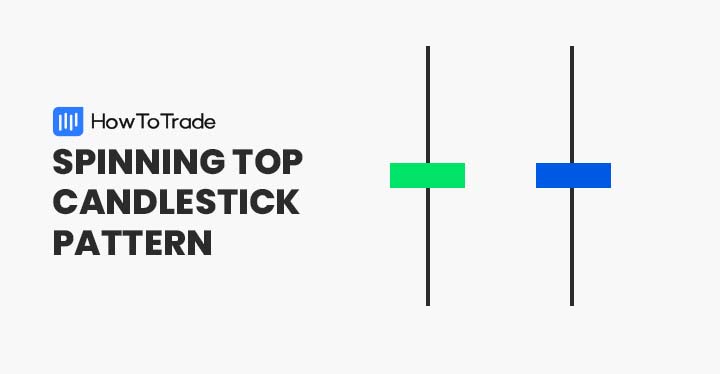
The spinning top is a candlestick pattern that signals indecision between buyers and sellers and may indicate a possible trend reversal. It is another common and effective candlestick reversal pattern used by traders to find trading opportunities and market trends.
Keep reading if you want to learn more about the spinning top bullish and bearish pattern and how to use these candlestick formations in trading.
 Table of Contents
What is the Spinning Top Candlestick Pattern?
The spinning top candlestick pattern, or spinning bottom pattern, occurs when buyers and sellers find price equilibrium in a certain period of time, which indicates indecision in the market.
Much like the Doji candlestick pattern, spinning tops usually appear at the top or bottom of a trend and signal indecisiveness in the market and therefore, are considered neutral candlestick patterns.
As a neutral candlestick pattern, the spinning top can be formed in charts in different scenarios. It is, therefore, can be bullish or bearish. The implication of this candlestick pattern is temporary uncertainty in the market and indecision from forex market participants about the next price movement of the specified currency pair.
How to Identify the Spinning Top Candlestick Pattern?
As we mentioned, the spinning top candle pattern is very similar to the Doji candlestick pattern with one major difference – while the Doji candle doesn’t have a body and the opening and closing price are exactly the same, spinning tops have a minor difference in the open and close price of the specified time frame.
To identify the pattern, you first need to get familiar with the structure and characteristics of the spinning top formation. It has a really small body (the difference between the opening price and closing price), and very long upper and lower wicks (shadows).
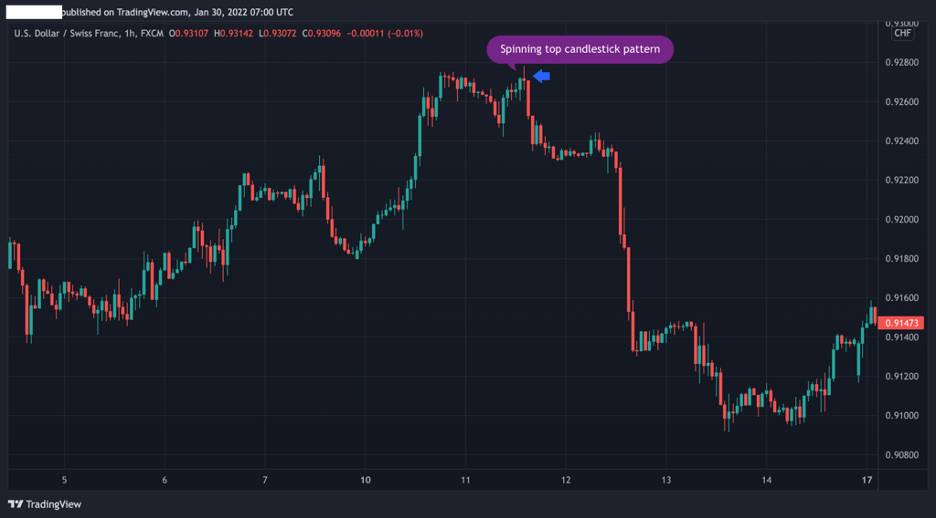
Let’s see what the spinning top pattern looks like on a trading chart.

As you can see in the USD/CHF 1H chart above, the spinning top chart pattern appears at the top of a trend and has the following features – small body, long upper and lower shadows.
Indeed, in the example above, this spinning top bearish pattern signals a trend reversal, and immediately after the next candle, a bearish trend begins.
To make things easier for you, you can follow the next steps to identify and use spinning top patterns in trading:
- Identify a spinning top pattern at the end of a bullish or bearish trend
- Draw Fibonacci levels from the lowest to the highest level of the previous trend
- Wait for the next candlestick to close above (or below) the closing price of the spinning top candle
- Enter a long or selling position
- Set a stop-loss order at the highest or lowest level of the spinning top pattern (depending on whether the pattern is bullish or bearish)
How to Trade the Spinning Top Candlestick Pattern?
Trading the spinning top candlestick pattern can be tricky. It is not a pattern that gives you a clear signal to enter or exit a position like the triple bottom pattern, or the hanging man pattern. Instead, it is a neutral candle pattern that can be interpreted as a situation of indecision between market participants.
As such, you need to use this candle pattern as another confluence trading tool to predict a trend reversal and combine it with other technical indicators in order to confirm the reversal.
Below, we are going to show you the two types of spinning top patterns combined with Fibonacci support and resistance levels – bullish and bearish spinning top patterns.
1. Bullish Spinning Top (Bottom) Candlestick Pattern
The bullish spinning top pattern occurs at the bottom of a downward trend and may signal a bullish trend reversal. Usually, when the pattern is formed, the chances of a trend reversal are very high as the asset enters a price consolidation mode.
In the USD/CHF chart below, we can see how the bullish spinning bottom pattern is formed at the end of a downward trend. As a confirmation, we used Fibonacci retracement levels drawn from the lowest level to the highest level of the previous trend.
As you can see, the market stopped exactly at the 61.8% Fibonacci level where the spinning top pattern was formed.
In such a scenario, a trader will enter a long position with a stop-loss order at the lowest level of the spinning top candle or at the 78.6% level.

2. Bearish Spinning Top Candlestick Pattern
In the other direction, a bearish spinning top pattern occurs at the top of a trend and may signal a price reversal and a new trend direction.
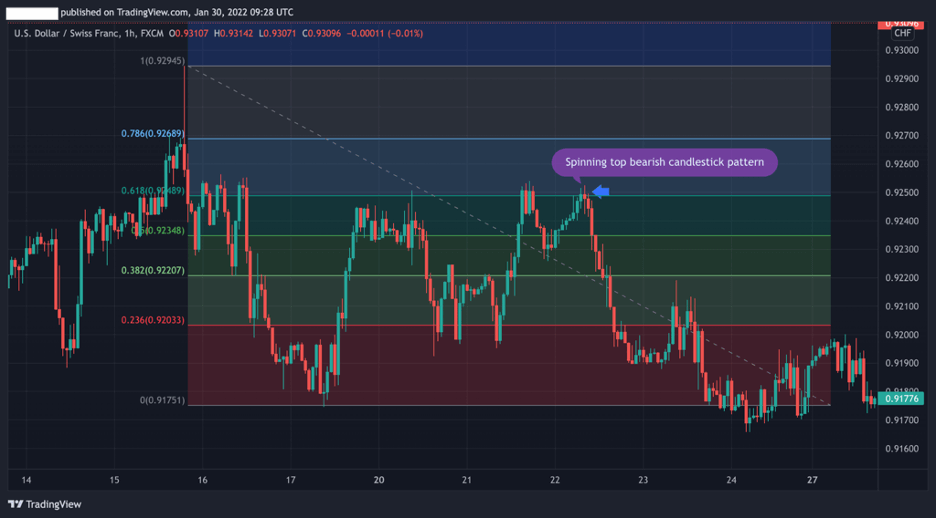
In the chart below, the spinning top pattern occurs at the end of an uptrend after the second double top. Therefore, in this example, we can see a combination of the spinning top pattern and the double top pattern.
To completely validate a trend reversal, we also added Fibonacci levels from the highest to the lowest price levels of the prior trend.
In this chart, we have the perfect combo to enter a short-selling position – that is, spinning top pattern, double top pattern, and the intersection at the 61.8% Fibonacci level.

Key Takeaways
In a nutshell, here’s what you need to know about spinning top patterns:
 Key Takeaways
- The spinning top candlestick is a charting formation that indicates indecision between buyers and sellers
- The spinning top pattern has the same candle structure and interpretation as the Doji candlestick pattern. The only difference is that spinning tops have a wider candle body
- In most cases, the spinning top pattern indicates a possibility for a trend reversal
- When the spinning top formation occurs, traders should wait for the next candle (or more than one candle) to be completed. Additionally, it is important to combine other trend reversal tools like Fibonacci ratios, RSI, moving averages, and MACD.
Risk Disclosure: The information provided in this article is not intended to give financial advice, recommend investments, guarantee profits, or shield you from losses. Our content is only for informational purposes and to help you understand the risks and complexity of these markets by providing objective analysis. Before trading, carefully consider your experience, financial goals, and risk tolerance. Trading involves significant potential for financial loss and isn't suitable for everyone.


