The inverted hammer candlestick pattern, also known as the inverse hammer pattern, is a type of bullish reversal candlestick formation that occurs at the end of a downtrend and signals a price trend reversal.
But how do you identify this pattern on price charts? And how do you find the right entry-level and stop loss placement?
Read on to learn more about one of the most significant candlestick patterns in trading – the inverted hammer candlestick pattern.
What is the Inverted Hammer Candlestick Pattern?
The inverted hammer candlestick pattern is a chart formation that occurs at the bottom of a downtrend and may indicate that the market price is about to reverse.
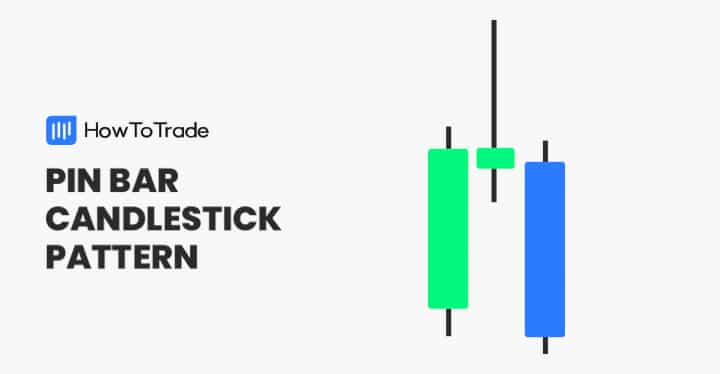
In its appearance, the inverted hammer candle looks exactly like an upside-down hammer and the opposite version of the hammer candle pattern. Additionally, it has the same structure as the shooting star candlestick pattern.
In terms of the implication of the pattern – the inverted hammer is a clear bullish trend reversal pattern and helps traders identify a possible reversal.
This means, that when a trader identifies the inverted hammer pattern and uses it as a trading strategy, the market sentiment is likely to change and a trader will be looking for a good level to enter a long position.
How to Identify and Use the Inverted Hammer Candlestick Pattern?
As mentioned, the inverted hammer has a very clear shape and it is fairly easy to identify this pattern on all currency pairs and in any time frame.
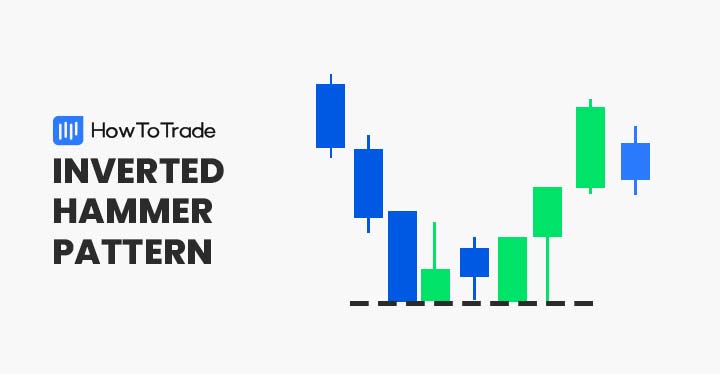
In all cases, the inverted hammer pattern appears at the end of a downward trend and has the following characteristics: long upper shadow, short lower shadow (or no lower shadow), and a small body.
As you can see in the EUR/USD 1H chart below, the inverted hammer bullish pattern occurs at the bottom of a downtrend and signals a trend reversal.
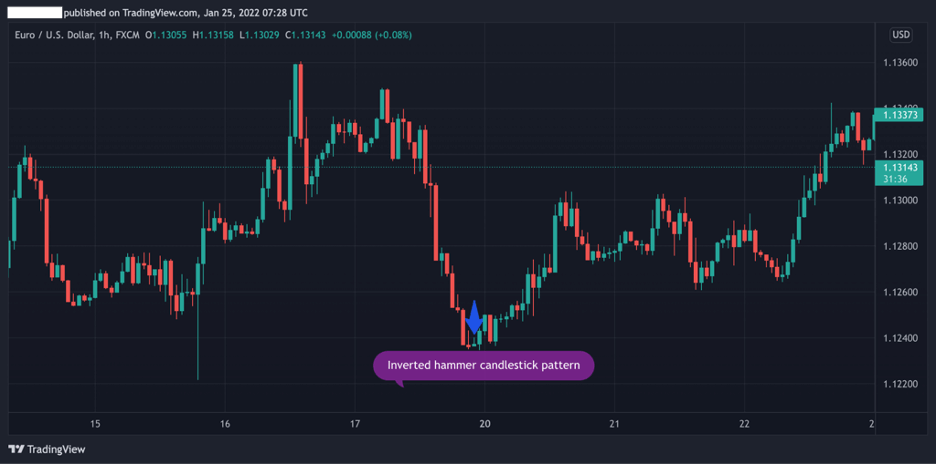
In this case, the next candle following the inverted hammer candle provides a strong indication that sellers lose control. As the next candle opens higher, a long position should be taken.
The bottom line – in order to identify and trade the inverted hammer candlestick pattern, follow the steps below:
- Identify a downward trend
- Find the inverted hammer candlestick pattern at the bottom of a downtrend with a long upper shadow, short lower shadow, and small body
- Wait until the price reverse and combine other technical analysis tools to confirm the trend reversal (RSI and MACD)
- Enter a long buying position
- Set a stop-loss order below the lowest price level of the inverted hammer candlestick
How to Trade the Inverted Hammer Candlestick Pattern?
Trading the inverted hammer candlestick pattern requires a trader to identify the pattern at the end of a downtrend and enter a long position. However, as there’s a high risk of entering a position at the end of a trend, it is also important to confirm the pattern with other technical indicators.
For that purpose, we want to focus on two technical analysis tools that will help you validate a potential trend reversal and find entry and exit levels.
Relative Strength Index (RSI) and Inverted Hammer Candlestick Pattern
The RSI is a popular trend reversal indicator that finds areas of overdemand or oversupply and may indicate a possible reversal. Usually, you’ll find this indicator on any charting software including the popular MetaTrader4.
When you add the RSI indicator to your charting platforms, you’ll be looking for a crossover around the 30 level and at the same time, the inverted hammer candlestick appears.

As you can see in the EUR/USD 1H chart above, the RSI helps us in identifying a trend reversal. The confirmation occurs when the candle following the inverted hammer candlestick is completed. Then, a trader will be entering a position with a stop loss below the lowest price level of the inverted hammer candle.
Fibonacci Retracement Levels and Inverted Hammer Candlestick Pattern
The second trading technique to combine with the inverted hammer pattern is Fibonacci retracement levels. Below, we used the same chart from the first example but this time, with Fibonacci levels drawn from the lowest to the highest level.
As seen in the chart, the inverted hammer candle occurs around the Fibonacci 38.2% level. In such a scenario, you’ll be looking to enter a position when the first candle is completed above the Fibonacci 38.2% level and place a stop-loss order below the lowest price level of the inverted hammer candlestick.

The Inverted Hammer Candlestick Pattern – Pros and Cons
These are the most common pros and cons of trading the inverted hammer candlestick pattern:
Pros
- Frequently occurring charting pattern
- Easy to identify
- There’s potential for high rewards
- The pattern provides a good stop-loss placement (SL should be placed below the lowest level of the inverted hammer candle)
Cons
- Risky trade as the trader buys the asset at the bottom of the trend
- Other technical analysis tools must be used to confirm a trend reversal
Everything About the Inverted Hammer Candle in One Video
Here’s a video by our trading analysts on how to identify and trade the inverted hammer candle pattern.
Key Takeaways
Here are the key takeaways you need to consider when using the inverted hammer candlestick pattern.
- The inverted hammer candlestick is a charting pattern that appears at the bottom of a downtrend
- The pattern has a long upper wick and little (or no) lower wick and a really small body (the difference between the opening price and the closing price)
- It is best to add other technical indicators to confirm a trend reversal – RSI and Fibonacci retracement levels
- When trading the inverted hammer candlestick pattern, traders will be looking to enter a long position after the following bullish candlestick is completed
- A stop loss should be placed below the lowest price level of the inverted hammer candle
Risk Disclosure: The information provided in this article is not intended to give financial advice, recommend investments, guarantee profits, or shield you from losses. Our content is only for informational purposes and to help you understand the risks and complexity of these markets by providing objective analysis. Before trading, carefully consider your experience, financial goals, and risk tolerance. Trading involves significant potential for financial loss and isn't suitable for everyone.