Are you baffled by Japanese candlestick patterns? A great place to boost your candlestick IQ is with the most basic pattern of all: the Doji pattern.
The Doji candlestick pattern is a single-candle pattern used to trade market reversals, breakouts, or consolidation. Read on to learn how to identify, classify, and trade Doji patterns in the live market.
What is the Doji Candlestick Pattern?
The Doji candlestick pattern is a single-candle chart pattern that occurs when a candle’s open is near-to or the same as its close. They resemble a “+” sign with a small body with defined upper and lower wicks.
Dojis come in several varieties with fascinating nicknames. A few of the most popular are the Long-legged Doji, Gravestone Doji, the Dragonfly Doji , and the Doji star candlestick pattern.
Regardless of type, each Doji conveys four essential data points to the trader: the periodic high, low, open, and close. Also, this single-candle pattern may occur in any timeframe and in any market. Thus, they are used as the basis for many trading strategies.
How to Identify and Use the Doji Pattern?
One of the best things about Dojis is that they are easy to identify in real-time. All one needs to do is look for a candle with the same open and close. Check out the image below for a picture of a traditional Doji pattern.

Due to the location of the opening and closing prices, Dojis are a signal of market consolidation. On their own, Dojis don’t signal a market bias. That’s why they differ from multi-candle formations such as a Bearish Engulfing Pattern or Three Black Crows — an isolated Doji isn’t a signal of market direction.
Integrating the Doji candlestick chart pattern into your trading isn’t difficult. Follow the process below, and you will be well on your way to apply the Doji candlestick strategy:
- Identify a Doji in any currency pair on any timeframe.
- Decide what type of Doji pattern is present.
- Examine where the pattern is within the context of the current price.
- Define whether the Doji pattern exists in a trending or flat market.
After executing these three steps, it is possible to trade Doji chart patterns in bullish or bearish market conditions. Strategically, it helps classify each Doji and trade according to its strengths and weaknesses.
Long-legged Doji
The Long-legged Doji pattern has an elongated upper and lower wick and a small body. It is pictured below:

The Long-legged Doji can be interpreted in several ways and works best when viewed in context with price action. The Long-legged Doji is a potential price reversal signal in a defined up or downtrend. If it occurs in a flat market, it suggests further consolidation.
Dragonfly Doji
The Dragonfly Doji sets up when the candle’s open, close, and high is approximately the same. Visually, the Dragonfly looks like a “T,” as depicted in the image below. This formation suggests that heavy selling was present, but the market has rebounded.
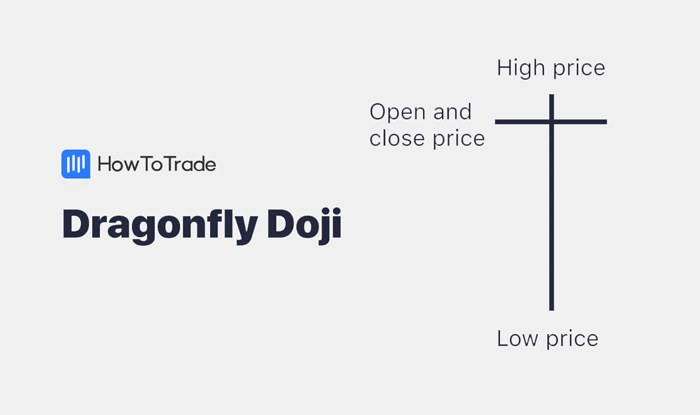
As a general rule, the Dragonfly is considered a reversal indicator. A retracement in price is expected when it occurs at the top of a bullish trend. Conversely, a bullish bounce is anticipated when it sets up at the bottom of a downward trend.
Gravestone Doji
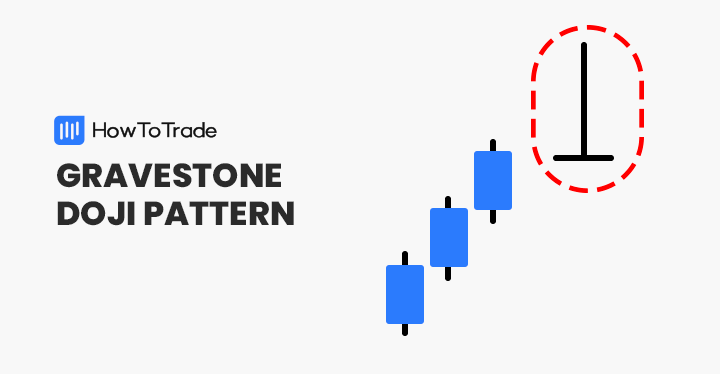
The Gravestone Doji pattern is the polar opposite of the Dragonfly; it appears as an inverted “T” and signals that heavy buying has given way to selling. Check out the picture below for a good look at the Gravestone.
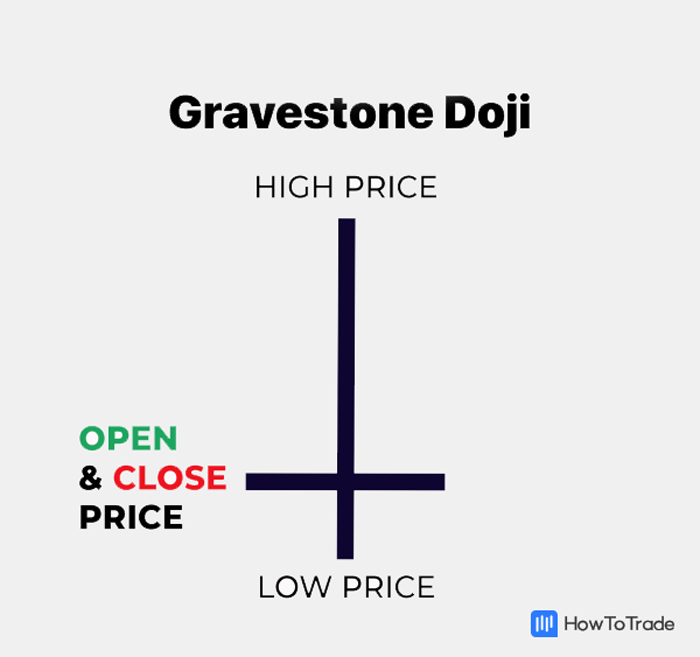
The Gravestone Doji is a reversal chart pattern that signals downward or upward pressure may be on the way. The Gravestone suggests that a reversal is possible when observed within a defined uptrend. Within a downtrend, bullish price action may be forthcoming.
How to Trade the Doji Candle Pattern?
One of the best things about Dojis is that they are versatile. Two trading strategies where they excel are the reversal and breakout methodologies. The Doji candle can be a powerful tool in your trading arsenal if utilized within a comprehensive trading plan.
Reversals
Doji candlesticks can be a great way to get in or out of the market in trending markets. The Gravestone and Dragonfly are ideal for reversal strategies as they indicate forthcoming upward and downward movements in price.
Below is a look at a Gravestone Doji chart pattern. As you can see, the trend is down, and the Gravestone has developed at the bottom of the trend.

Follow the steps below to trade a bullish price reversal using the Gravestone Doji:
- Identify the pattern
- Place a buy order above the Gravestone’s high
- Place a stop-loss order beneath the Gravestone’s low
- If the price moves above the high, manage the new long position
Breakouts
One of the lowest-risk ways to utilize Dojis in the FX market is to trade breakouts. A breakout is a sudden directional move in price. Dojis often precede breakouts, as they are a signal of indecisiveness. As soon as the market makes up its mind, a significant move may be in the offing.
The EUR/USD daily chart below illustrates this concept. You’ll notice that the EUR/USD is trading in an extended consolidation pattern. After the Doji candlestick forms, the price suddenly moves to the bull.

To trade this setup, follow the progression below:
- Identify the pattern in real-time
- Place a buy order above the Doji’s high
- Place a stop-loss order below the Doji’s low
- If the buy order is executed, manage the new long position
The process above may also be used to short the market by using a sell entry and placing the stop-loss above the high.
Doji Candlestick Pattern Trading Example
The daily chart below shows a Doji setting up on the USD/CAD. Let’s go through a real-world example of how to trade a potential bullish breakout.
[Chart, USD/CAD breakout]

- Identify the Doji
- Place a buy order one pip above the high at 1.2536
- Place a stop-loss order (sell) one pip below the low at 1.2469
- Implement a 1:1 risk vs. reward ratio, 67 pips to return 67 pips
As you can see, the trade above hasn’t unfolded yet. If this market breaks north 67 pips before the low of 1.2469 is hit, this Doji breakout strategy would succeed.
The Doji Candlestick Patterns – Pros and Cons
Like all facets of technical analysis, Dojis have a unique collection of pros and cons. Below are a few of the most important.
Pros
- Easy to identify
- A reliable indicator of market consolidation
- Ideal for trading breakouts and reversals
Cons
- Somewhat rare on larger duration charts
- Can produce false signals
- Occur frequently in “whipsaw” and “choppy” market conditions
Everything About the Doji Candle Pattern in One Video
You can check our video by our trading analysts on how to identify and trade the Doji candle pattern.
Key Takeaways
In conclusion, here are the key points of trading the Doji candle pattern.
- The Doji is a single-candle chart pattern. It occurs when a candle’s opening and closing price are approximately the same.
- Upon forming, Dojis signal market indecisiveness and consolidation.
- The pattern comes in four primary varieties: standard, Long-legged, Dragonfly, and Gravestone.
- Doji candlestick patterns are great for trading bullish/bearish reversals and breakouts.
- The primary drawback of all Dojis is that they frequently produce false signals.
Risk Disclosure: The information provided in this article is not intended to give financial advice, recommend investments, guarantee profits, or shield you from losses. Our content is only for informational purposes and to help you understand the risks and complexity of these markets by providing objective analysis. Before trading, carefully consider your experience, financial goals, and risk tolerance. Trading involves significant potential for financial loss and isn't suitable for everyone.